


Precision ECG Analyzer with Edge Impulse and Arduino Nano 33 BLE Sense
Components and supplies
 |
| × | 1 | |||
 |
| × | 1 | |||
 |
| × | 1 |
Necessary tools and machines
 |
| |||
 |
| |||
 |
|
Apps and online services
 |
| |||
 |
| |||
 |
| |||
 |
|
About this project
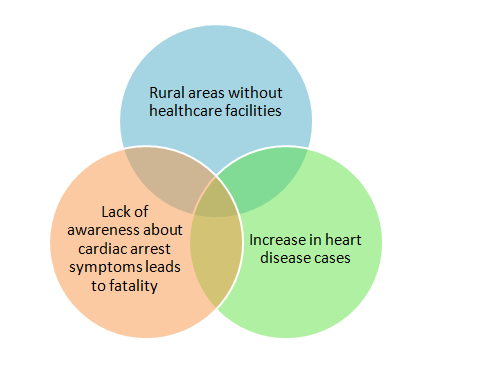
Sudden heart attack and increase in fatality : Growing ConcernIn a past decade, the sudden heart attack deaths were increased tremendously.
Particularly in a developing nations like India, apart from genetic and life styles, lack of medical resources in rural areas causes most of the fatality in heart attack.
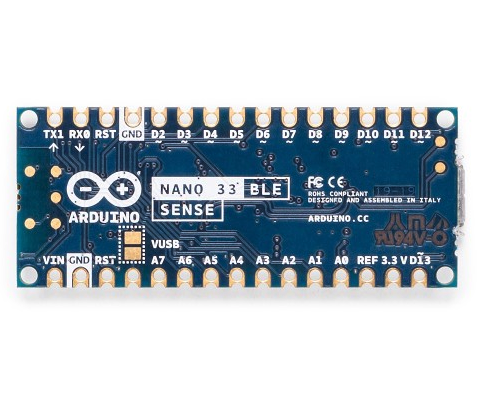
I worked on a TinyML application powered by Edge Impulse to develop a mini-Diagnosis ECG analyzer device which can fit in a pocket and it can diagnose heart diseases independently without a cloud connectivity.
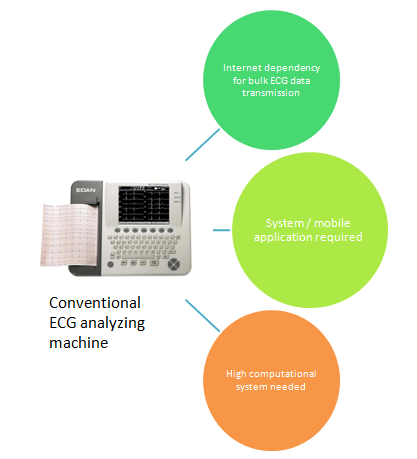
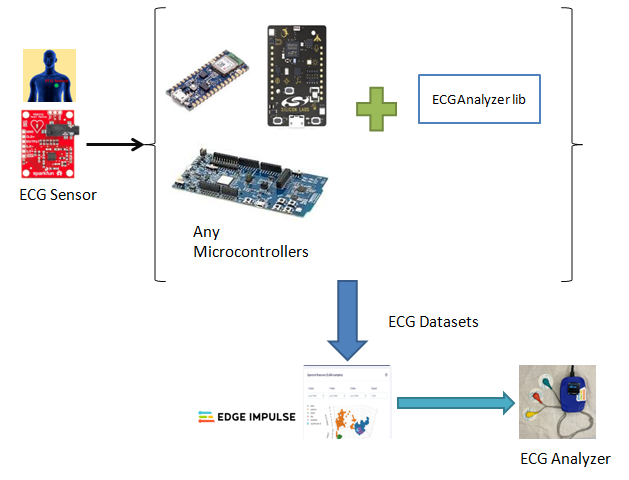
Present ECG Analyzer machines in market and its features•Present IoT Medical device sends bulk ECG data to the mobile/server and analysis is done in high processor / mobile App
•Computer based application which receives signals from ECG device and analyze the ECG patterns
•All the ECG analyzing device has dependency on Internet or high processing computers/ Mobile application.
So this can be summarized in below chart;
•ECG Analyzer powered by Edge Impulse will analyze the ECG data without any dependency on the Internet.
•Latency is lowest compared to IoT devices
•A 15Kb Rom - ECG Analyzing TinyML model can run on any TinyML supported microcontrollers.
•The device will analyze ECG patterns and classify into Normal, Atrial Fibrillation and First-Degree heart block
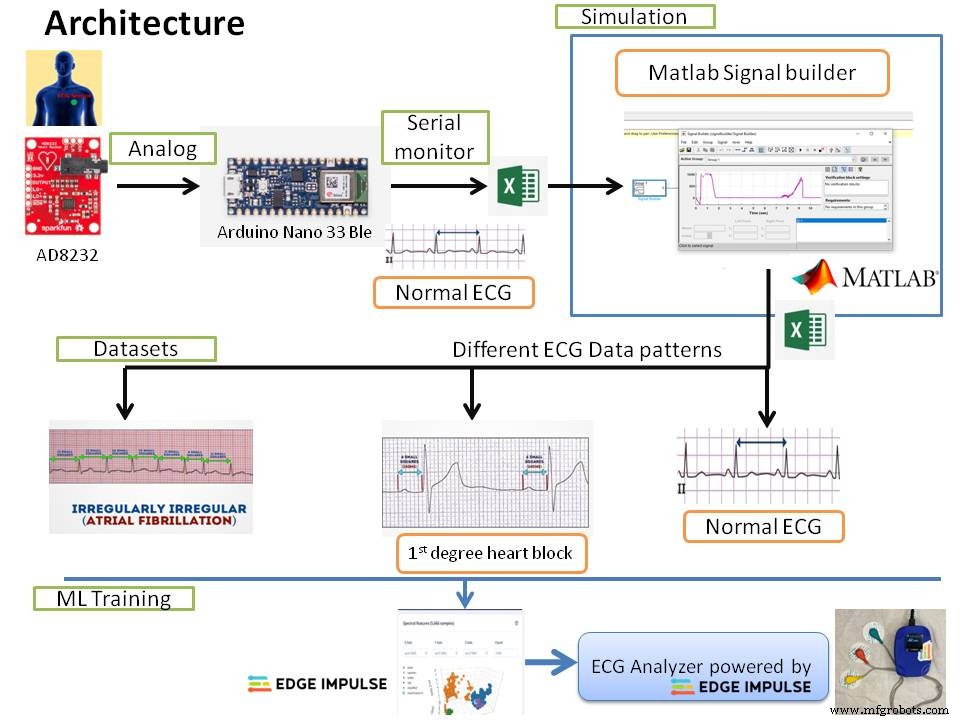
ArchitectureThe ECG analyzer involves
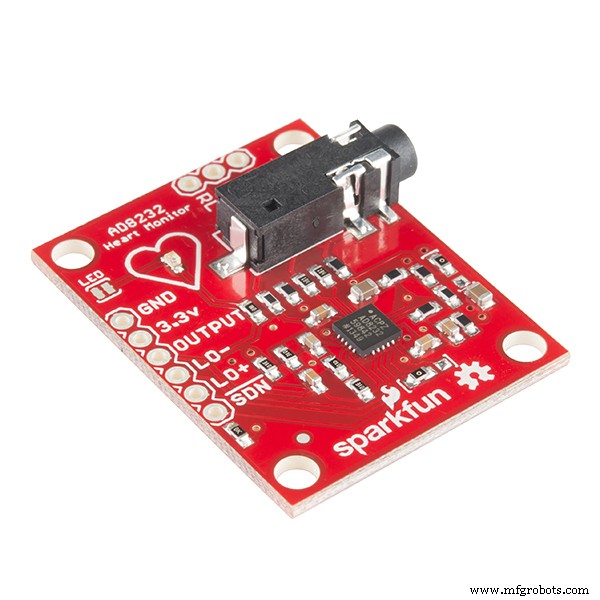
1. ECG reading using AD8232
2. Simulating different heart disease ECG patterns
3.Novel approach to produce quality datasets
4.Training the Model
5.Model test accuracy andIntegratingapplication code with deployedlibrary
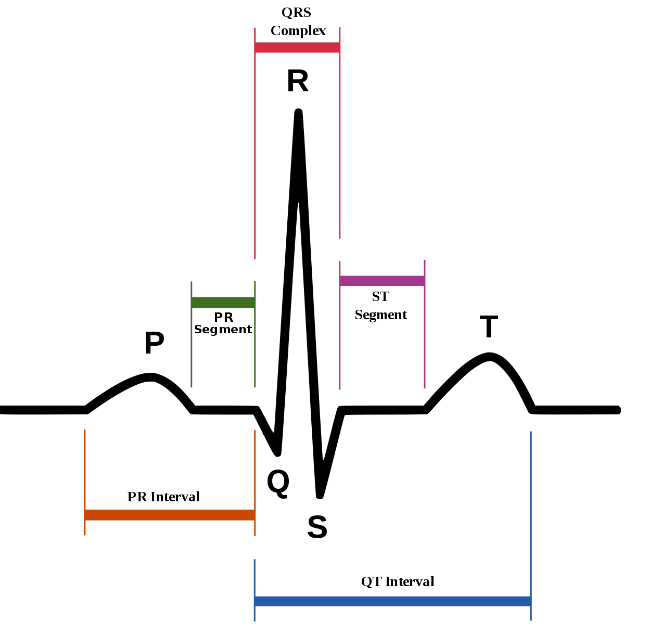
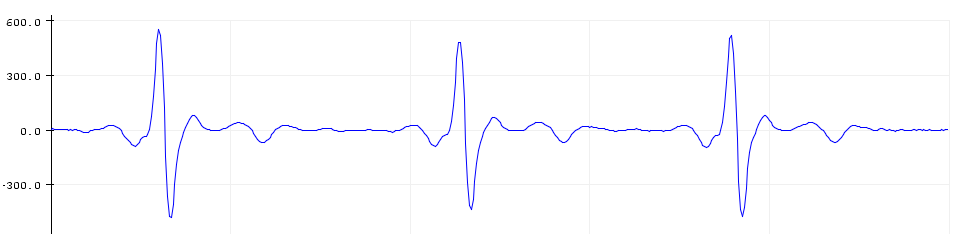
Before proceeding with the technical work, first will go through some basics of ECG graph.
The ECG graph was split into 5 Waves - P, Q, R, S and T waves.
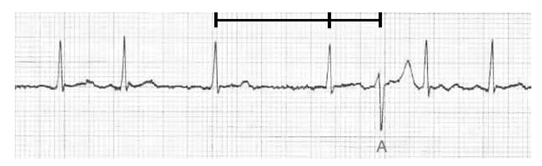
Atrial Fibrillation
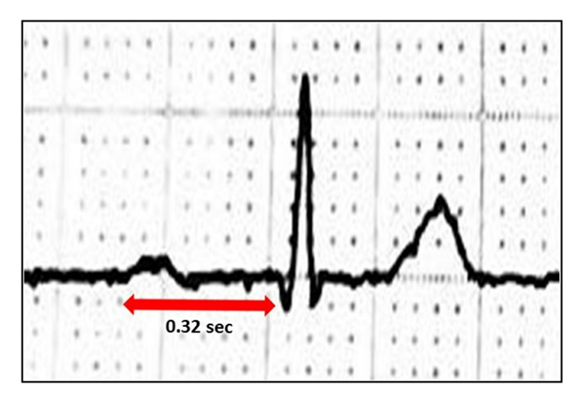
First-Degree Heart Block
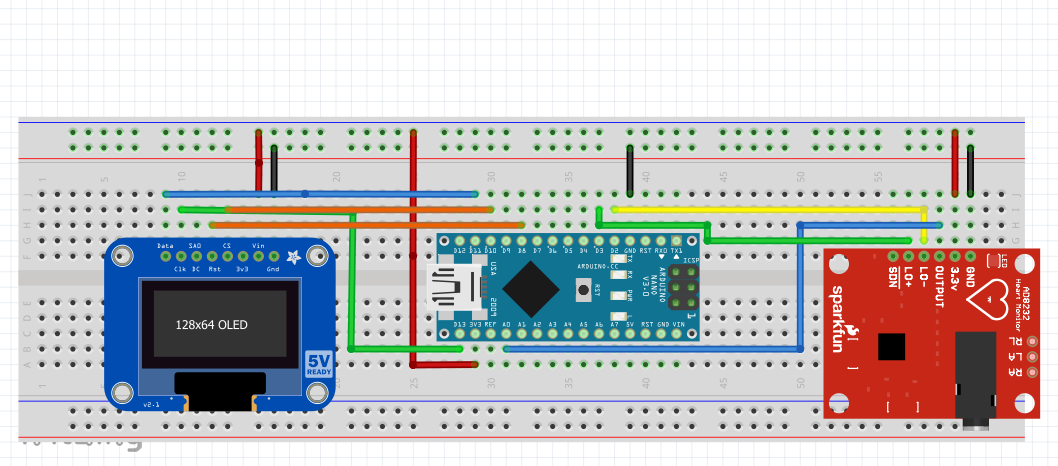
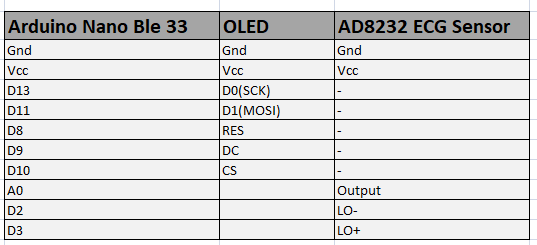
Connect the ECG sensor AD8232 to the Arduino Nano 33 BLE sense as per the below connection diagram.
Flash the below code and then press "Ctrl+Shift+L" to visualize the graphical streaming data.
void setup() {
// initialize the serial communication:
Serial.begin(115200);
pinMode(2, INPUT); // Setup for leads off detection LO +
pinMode(3, INPUT); // Setup for leads off detection LO -
}
void loop() {
if((digitalRead(2) == 1)||(digitalRead(3) == 1)){
Serial.println('!');
}
else{
// send the value of analog input 0:
Serial.println(analogRead(A0));
}
//Wait for a bit to keep serial data from saturating
delay(5);
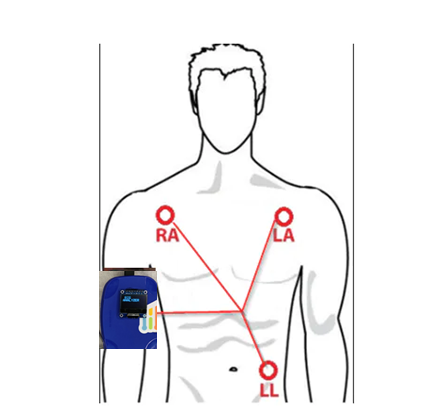
}1.1 Placement of ECG electrodes
The ECG electrodes are placed in RA, LA and LL as mentioned in above diagram and connect the jack to the AD8232 sensor on the ECG Analyzer.
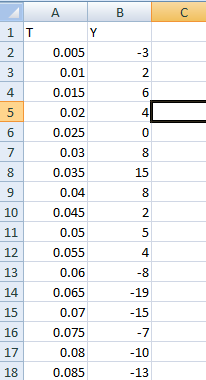
Step2.1 : Save the normal ECG data in Excel
First copy and save the serial monitor data into the excel file as below template. The ECG value should be in second column under 'Y'. The first column is time series. it should be incremented as ( * 0.005) 5ms.
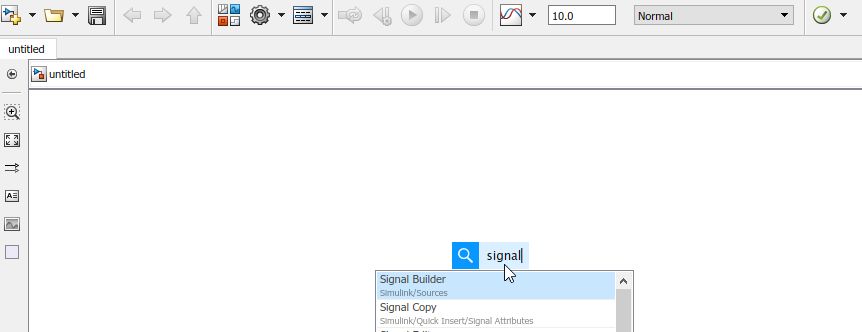
Step2.2 : Signal builder in Matlab
Create a new Simulink model in Matlab
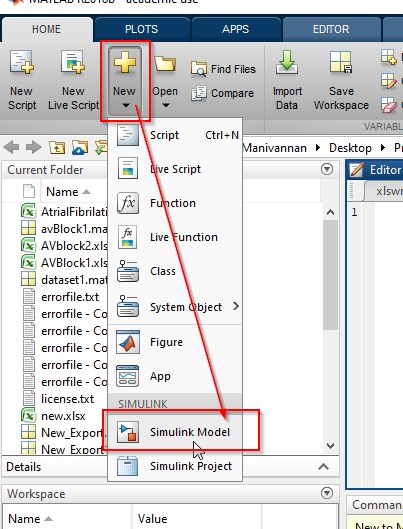
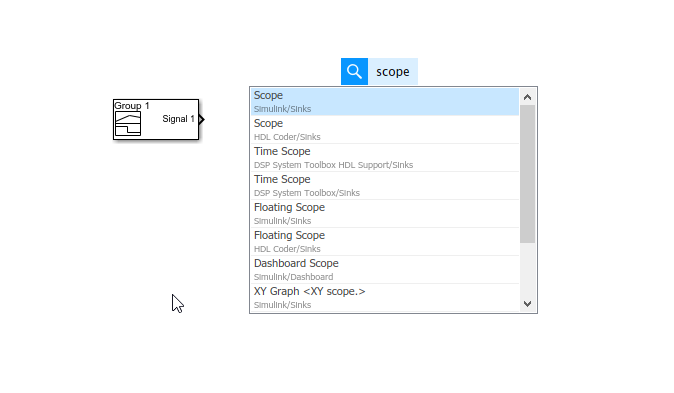
Then type 'signal builder' in workspace and select it. Also insert
the 'scope' to connect it to the signal builder. Please refer the below screenshot.
To load the saved excel data, open the signal builder and select 'import from file' option.
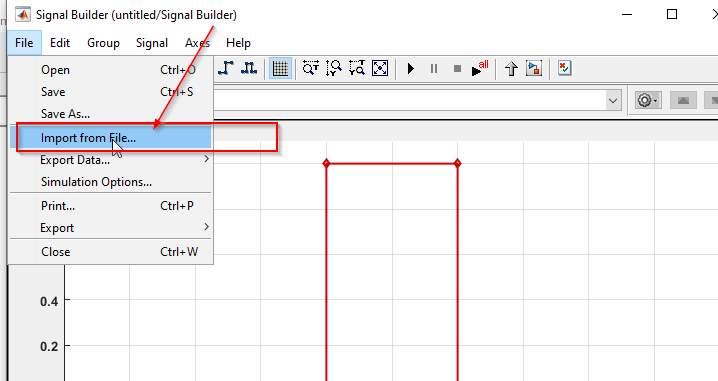
Please select the mentioned options to import the data.
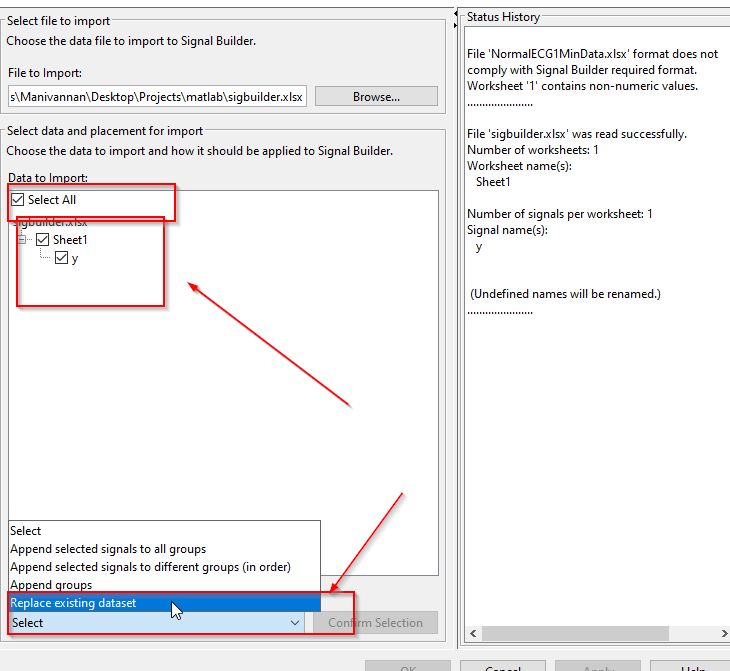
Then confirm the selection and import without saving the model. since we need to some more steps.
2.3 : ECG Data visualization in signal builder
A 60 second ECG data will be look like this in signal builder view, For manual editing, Please zoom it for 5 seconds data and the do 'drag' to edit the ECG wave.
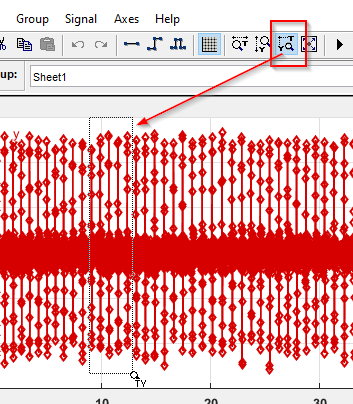
After Zooming, when you place the mouse pointer close to the ECG wave, you can able to select any points in the ECG and drag it as per your application requirement.
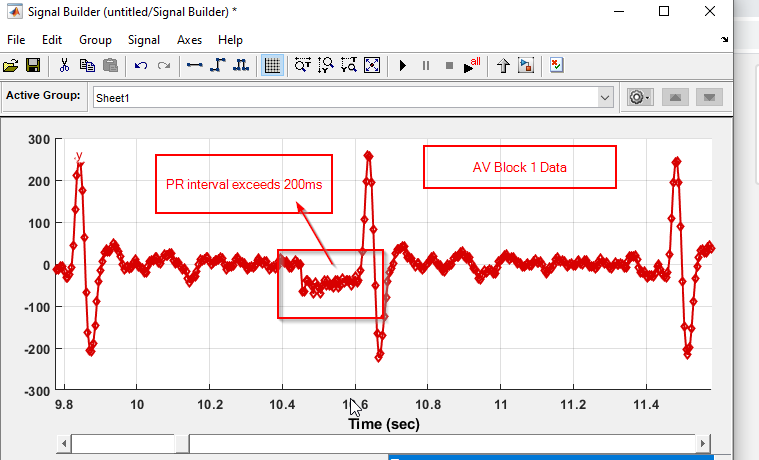
2.4 : Editing P-R interval data in Signal builder for AV Block 1 Case
I have manually drag down the P wave and shift the P wave much before the R wave, so that the P-R interval exceeds 200ms.
Repeat this step in different timeline in signal builder data.
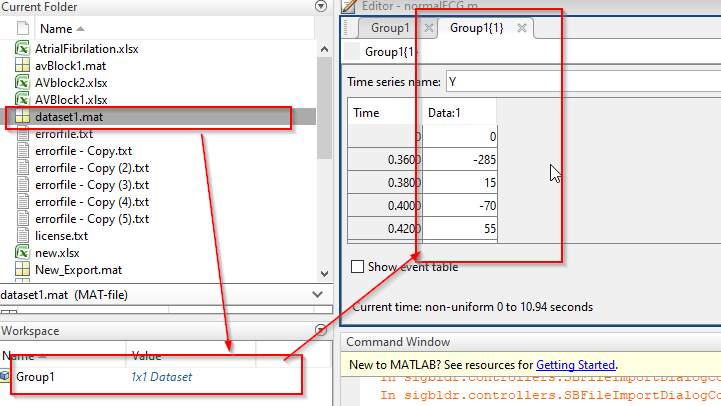
After editing, Export the data into the mat file. you can find this option in signal builder. Once the mat file is saved, Kindly follow the below steps.
Steps to follow --> Double click mat file first and double click the 1x1 Dataset--> you can see the modified data under Data:1.
Copy and paste the data in new excel file.
Step2.5 : Export the excel data into Array
I have wrote a.m script which can convert the excel data into a array.
Run this script in Matlab, before running replace the ExcelFilename with your local saved file name and ExcelSheetName into a corresponding sheet name.
data=xlsread('ExcelFilename.xlsx','ExcelSheetName');
ECGExtract=(data(1:end,1)); %%Column A data
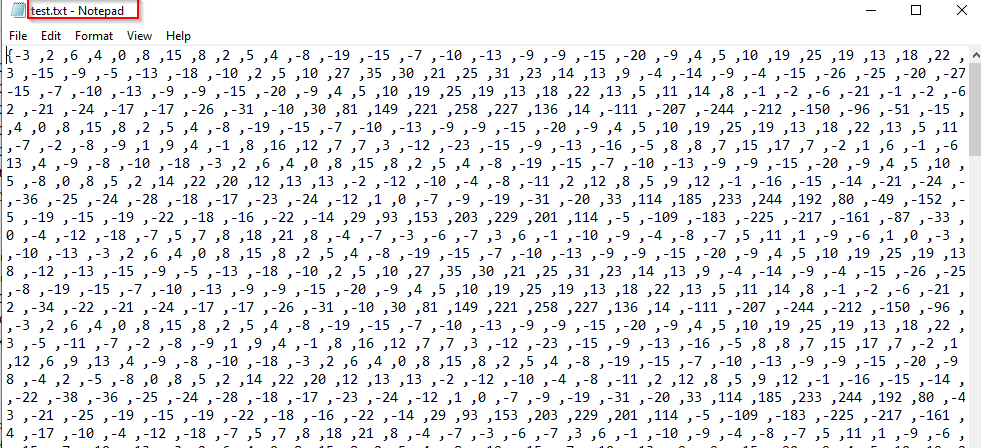
fid=fopen('test.txt','wt');%opening with the t flag auto-converts \n to \r\n on Windows
fprintf(fid,'{');
FormatSpec=[repmat('%i ',1,size(ECGExtract,2)) ','];%or should that have been \r\n instead?
fprintf(fid,FormatSpec, ECGExtract);
fprintf(fid,'}')
fclose(fid);The text file will be generated in the current directory location.
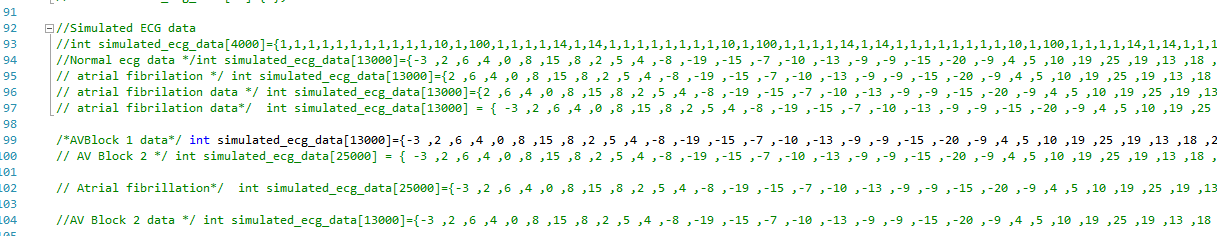
Copy the array content and paste it in the ECGAnalyzer.c code for simulating Atrial fibrillation and First-Degree heart block.
If you look at ECG data, its really hard to distinguish the different heart conditions ECG data with normal ECG data in a lesser window time(example: 3 secs)
When I train a model with Filtered ECG Data alone for atrial fibrillation, Normal and First-Degree Heart block, The accuracy was less than 23%. The reason was in the shorter window the model can't differentiate the difference.
If I go for longer window time, the processing time and peak RAM usage was increased quite a lot. Even There was no accuracy.
Background of Novel approach:
When a doctor or Trained person try to analyze the ECG graph, They will be counting the small boxes between R to R wave, P to R interval and write it down the counts in the graph or memories it for calculation.

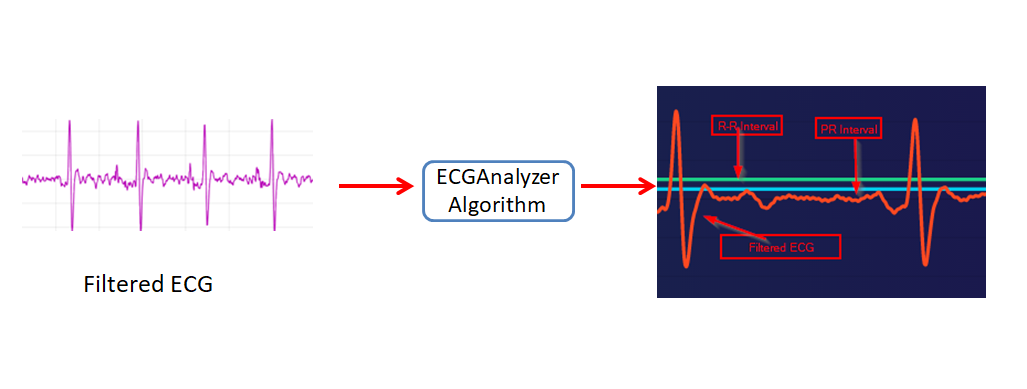
I created a separate waveforms from filtered ECG data.
New waveforms:
- R-R Interval
- PR Interval
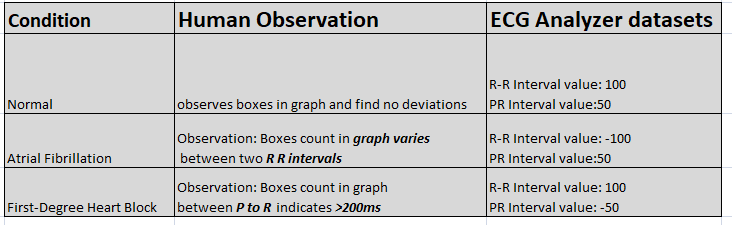
Generated Datasets for Normal ECGdata :
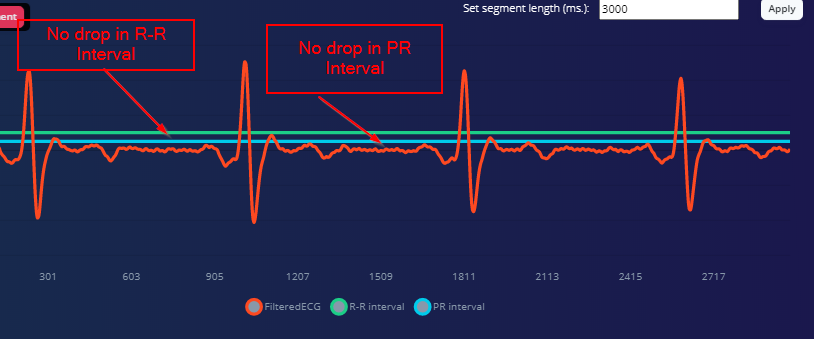
The decoded R-R interval and PR interval data is always 100 and 50 for normal ECG Data.
Generated Datasets for Atrial Fibrillation- ECG Data:
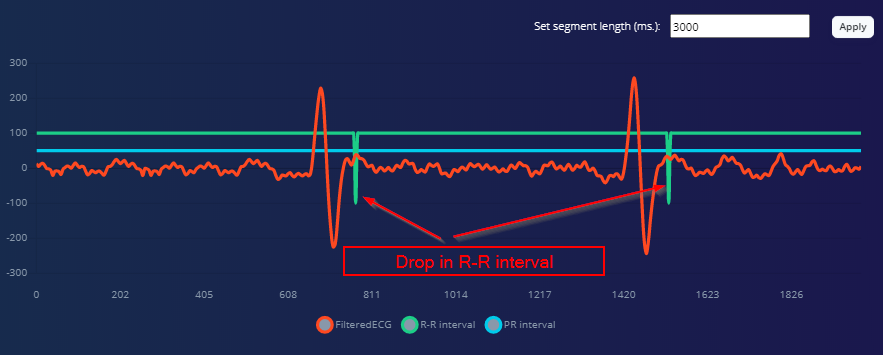
Whenever there is a deviation between previous R-R interval and present R-R interval, R-R interval data will be dropped to -100 for one cycle.
Generated Datasets for First-Degree Heart Block-ECG Data:
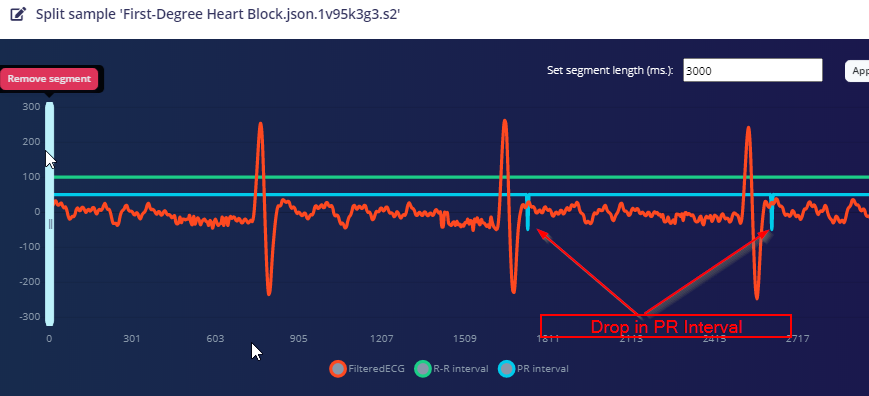
Whenever the P to R interval exceeds 200ms, then PR Interval data will be dropped to -50 for one cycle.
This approach improved my model accuracy to greater than 90%.
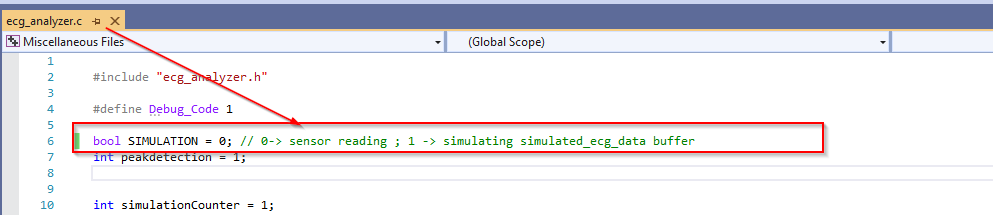
4. Training the Model in Edge ImpulseBefore getting into Edge Impulse training ML, we need to configure some parameters in library file for simulation and real time ECG sensor reading.
step4.1 : configure the SIMULATION to 0, If the data acquisition was from real time ECG sensor reading
or
Configure the SIMULATION to 1, If the data acquisition was from simulated ECG data for Atrial fibrillation and First-Degree Heart Block( followed Matlab sessions).
Step4.2 : Comment/uncomment the required databuffer for simulation
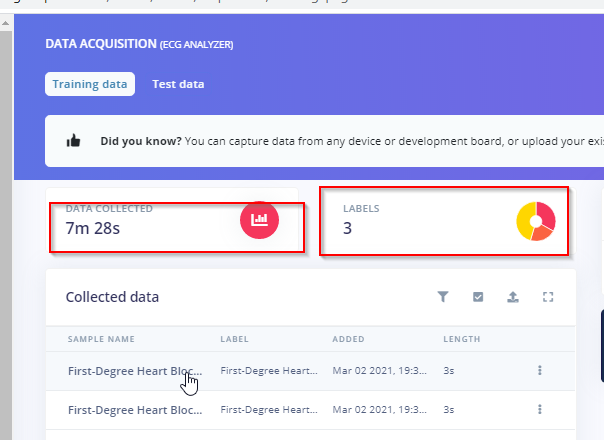
Step4.3 : Data acquisition
Collect the ECG data under three different labels : Normal, Atrial fibrillation and First-Degree Heart Block
https://docs.edgeimpulse.com/docs/arduino-nano-33-ble-sense
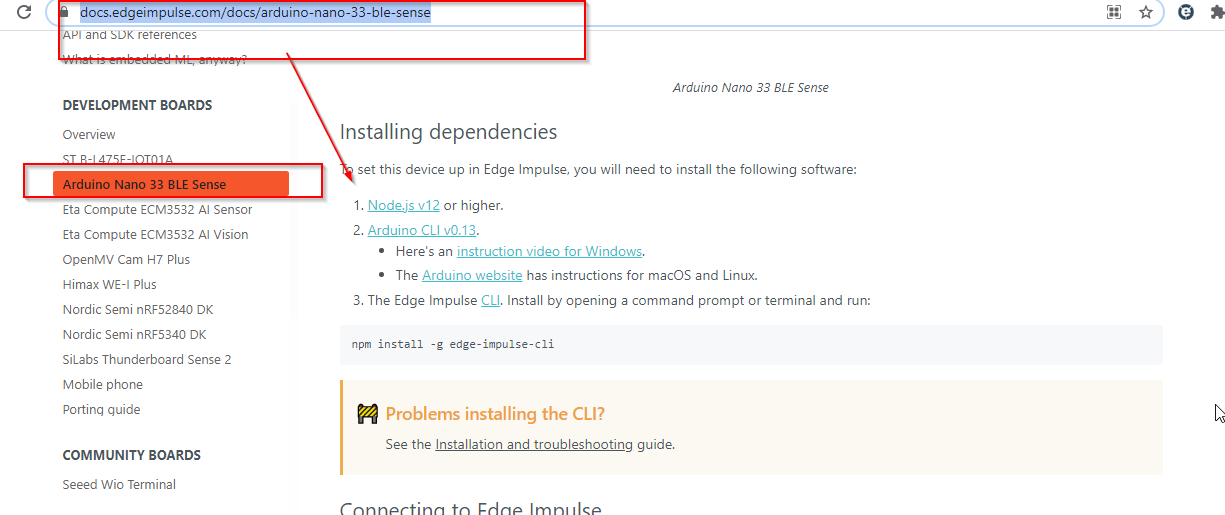
and select the frequency as 202
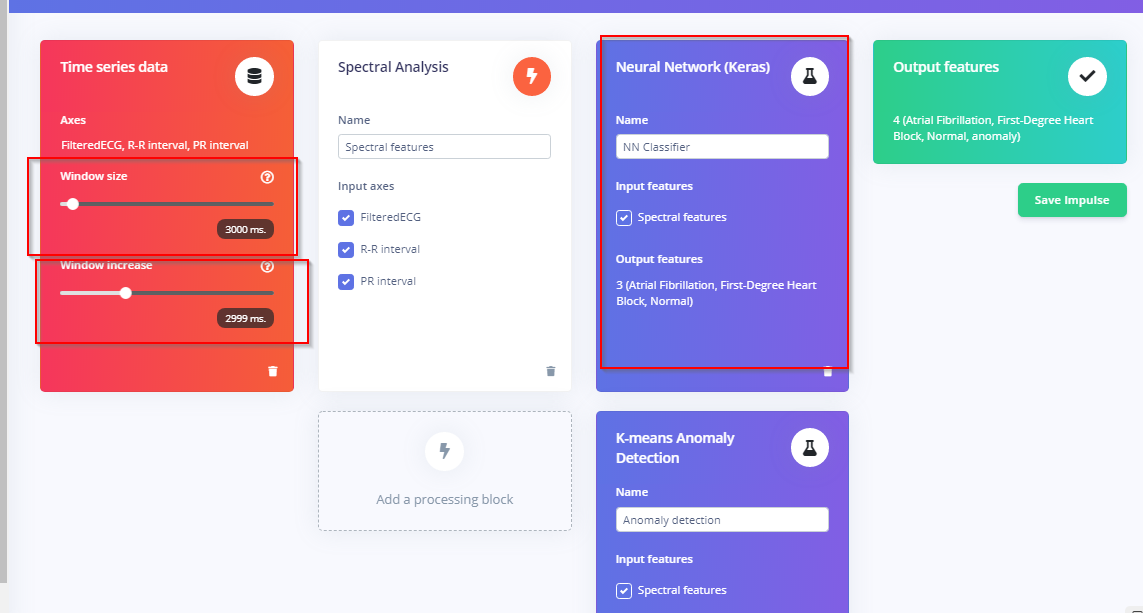
$ edge-impulse-daemon --frequency 202Step4.4 : Create Impulse
In a create impulse section, window size is 3000ms and window increase is 2999ms, select the k-means anomaly detection
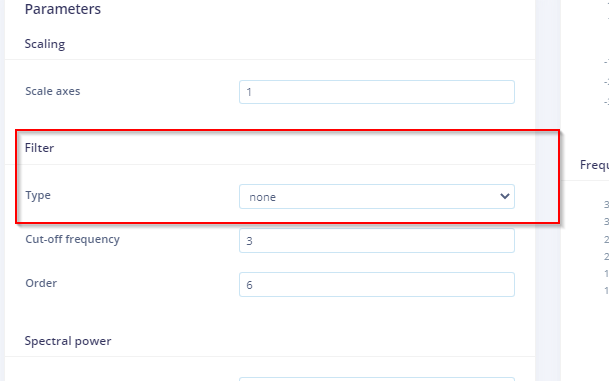
Step 4.5: Spectral features
In a spectral features, select the filter type as None.
Step 4.6 : NN Classifier:
I have set 40 number of training cycles and learning rate as 0.005. I have got 92.9 accuracy.
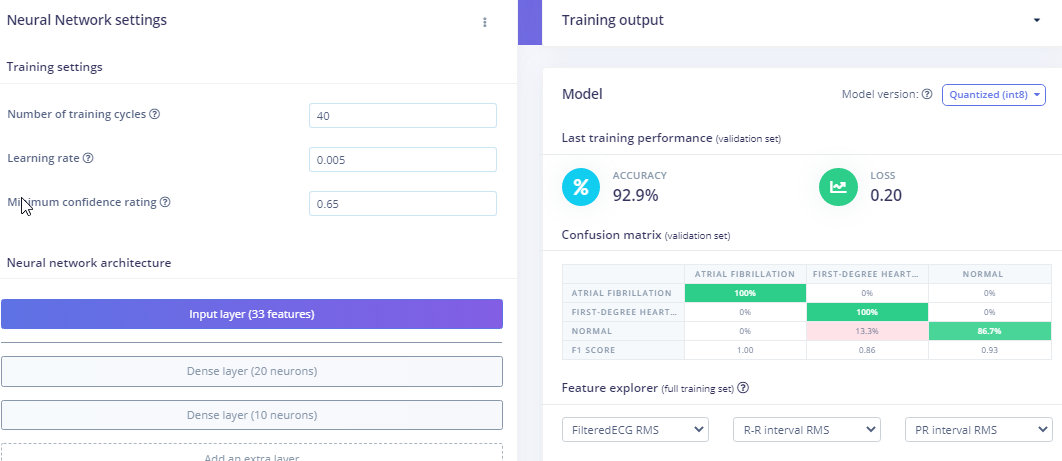
and for Anomaly detection, I have selected PR interval RMS and RR interval RMS.
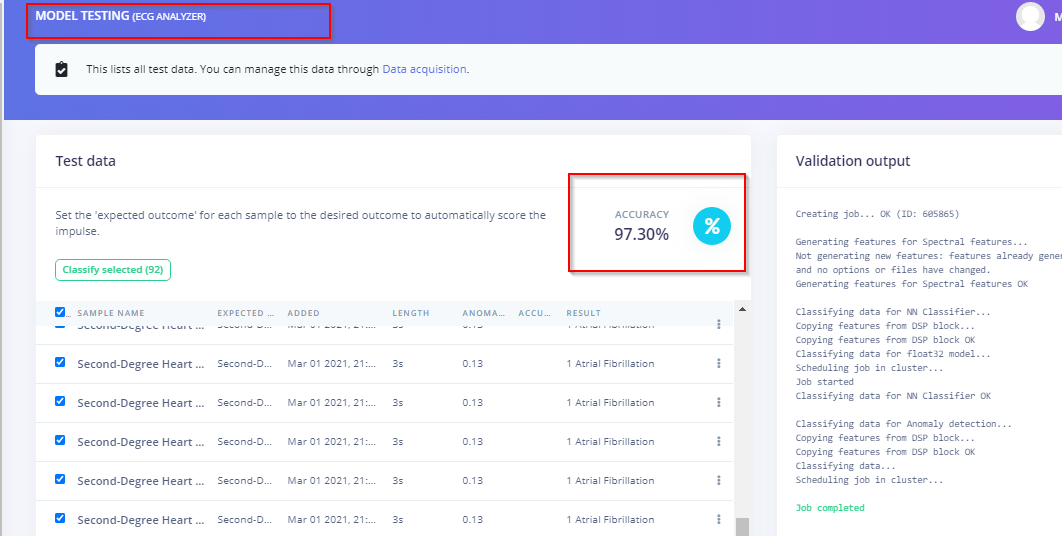
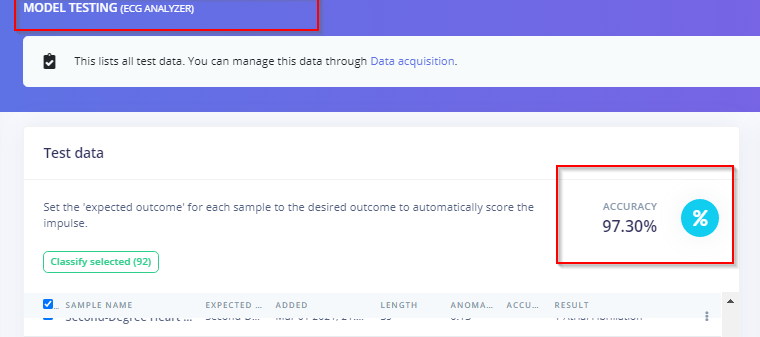
5. Model test accuracy & IntegrationIn a model test accuracy, it came around 97% accurate.
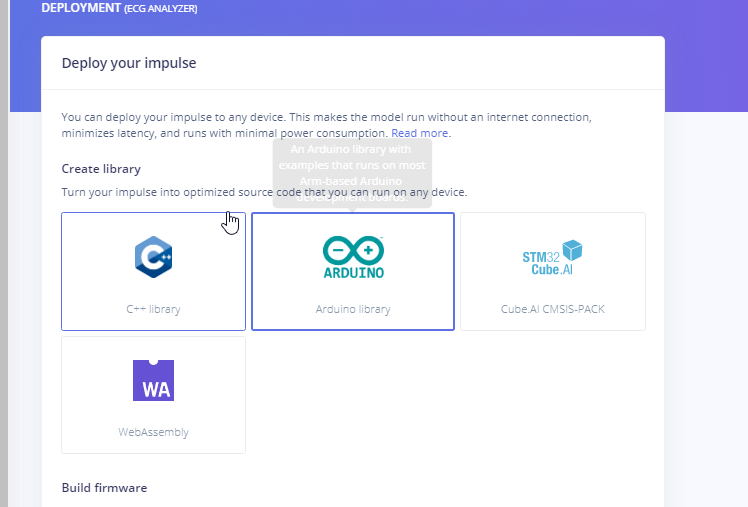
5.1Deployment:
select Arduino as deployment ;
Add the downloaded EI deployed file to the Arduino library
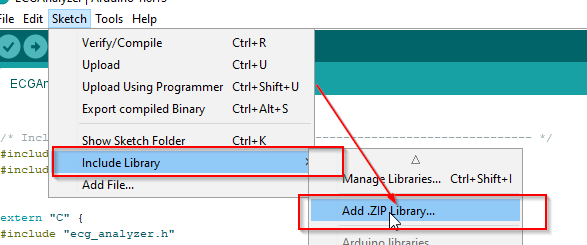
Note: Add the ECG_Analyzer library from GitHub link to the Arduino library too
This helps to integrate my ECG decoding algorithm code to integrate with EI generated model.
5.2 Integrating Application code to the core generated EI code
I have merged the application code into EI deployed "nano_ble33_sense_accelerometer_continuous" and saved it as ECGAnalyzer.ino.
It is available in attached GitHub link. Flash the code with SIMULATION as 0 in ECG_Analyzer.c in device.
Connect as per the fritzing diagram:
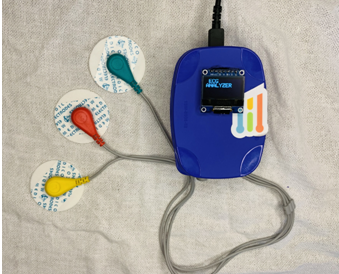
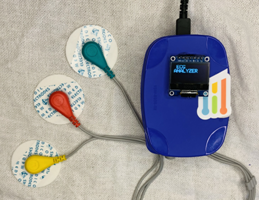
Assembling :
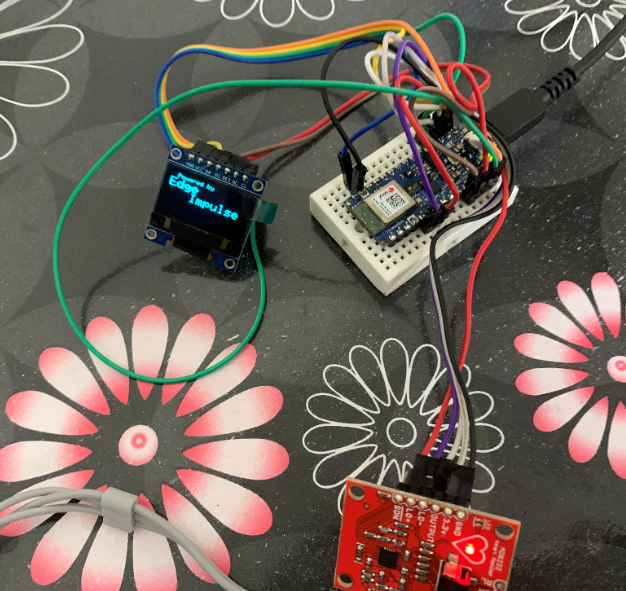
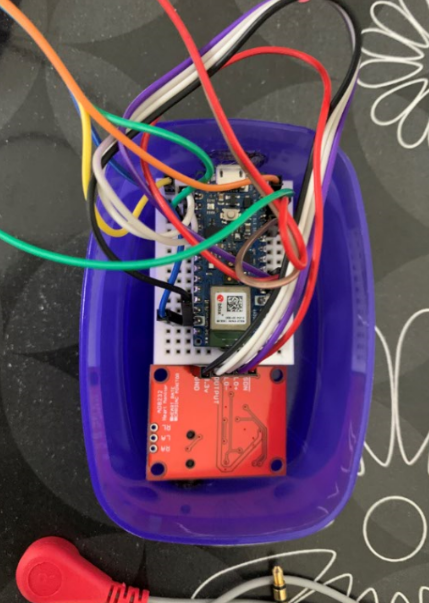
Here the final product and the accuracy level in test data!!!
ECG : https://geekymedics.com/how-to-read-an-ecg/
Code
https://github.com/Manivannan-maker/ECGAnalyzer
unzip the ECGAnalyzer.zip Code to Flash: EI_Deployed_Library\examples\ECGAnalyzer\ECGAnalyzer.ino Library to Edit simulation : ECGAnalyzer_lib\ecg_analyzer.c Matlab script and signalbuilder model: script to run in matlab --> Matlab_Simulation\Excel2Arrayconverter.m Signal builder --> Matlab_Simulation\signalbuilder.slxhttps://github.com/Manivannan-maker/ECGAnalyzerSchematics
Connect as per the diagramecgdefault_SjMMcgW8jY.fzz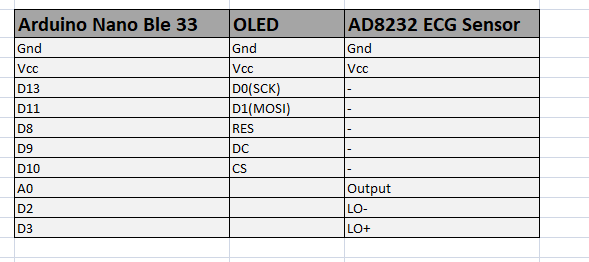
Manufacturing process
- The Art and Craft of Tiaras: History, Materials, and Modern Design
- Lead Crystal: History, Craftsmanship, and Future of a Timeless Glass
- Barbed Wire Explained: History, Construction, and Modern Uses
- Lead: Production, Applications, and Environmental Considerations
- Walabot‑Powered Toilet Hygiene Monitor
- Hands‑On Machine‑Learning with the reTerminal: Edge Impulse & ARM NN Demo Guide
- TinyML Language Detector with Edge Impulse on Arduino Nano 33 BLE Sense
- MOSMusic Project Kit: MOSFET, Arduino, and More
- Advanced Arduino-Based ECG Monitor for Real-Time Heart Rate Detection
- 6 Organization Types Driving the Edge Computing Revolution