


Mastering Current–Voltage Curves: Solar Cells, Batteries, and Emerging Materials
This article explores the techniques for measuring and interpreting the current‑voltage characteristics of solar cells, batteries, and innovative materials.
This technical piece focuses on the use of I‑V curves from ideal, linear components to analyze how various materials behave as electronic devices. While background information on device operation is provided elsewhere, the emphasis here is on understanding their I‑V responses.
Suggested Reading
- Understanding Current‑Voltage Curves
- Understanding Current‑Voltage Curves of Non‑Linear Devices
I‑V Curves of Solar Cells
Solar cells are photoelectric devices that convert incident light into electrical energy. When photons strike the photovoltaic semiconductor, they generate free carriers that can be harnessed as current.
With a load resistor in the circuit, the cell produces current upon illumination. The I‑V relationship is obtained via load‑switching, where different resistor values are connected across the cell and the resulting voltage and current are recorded.
Typical I‑V curves are illustrated in Figure 1.
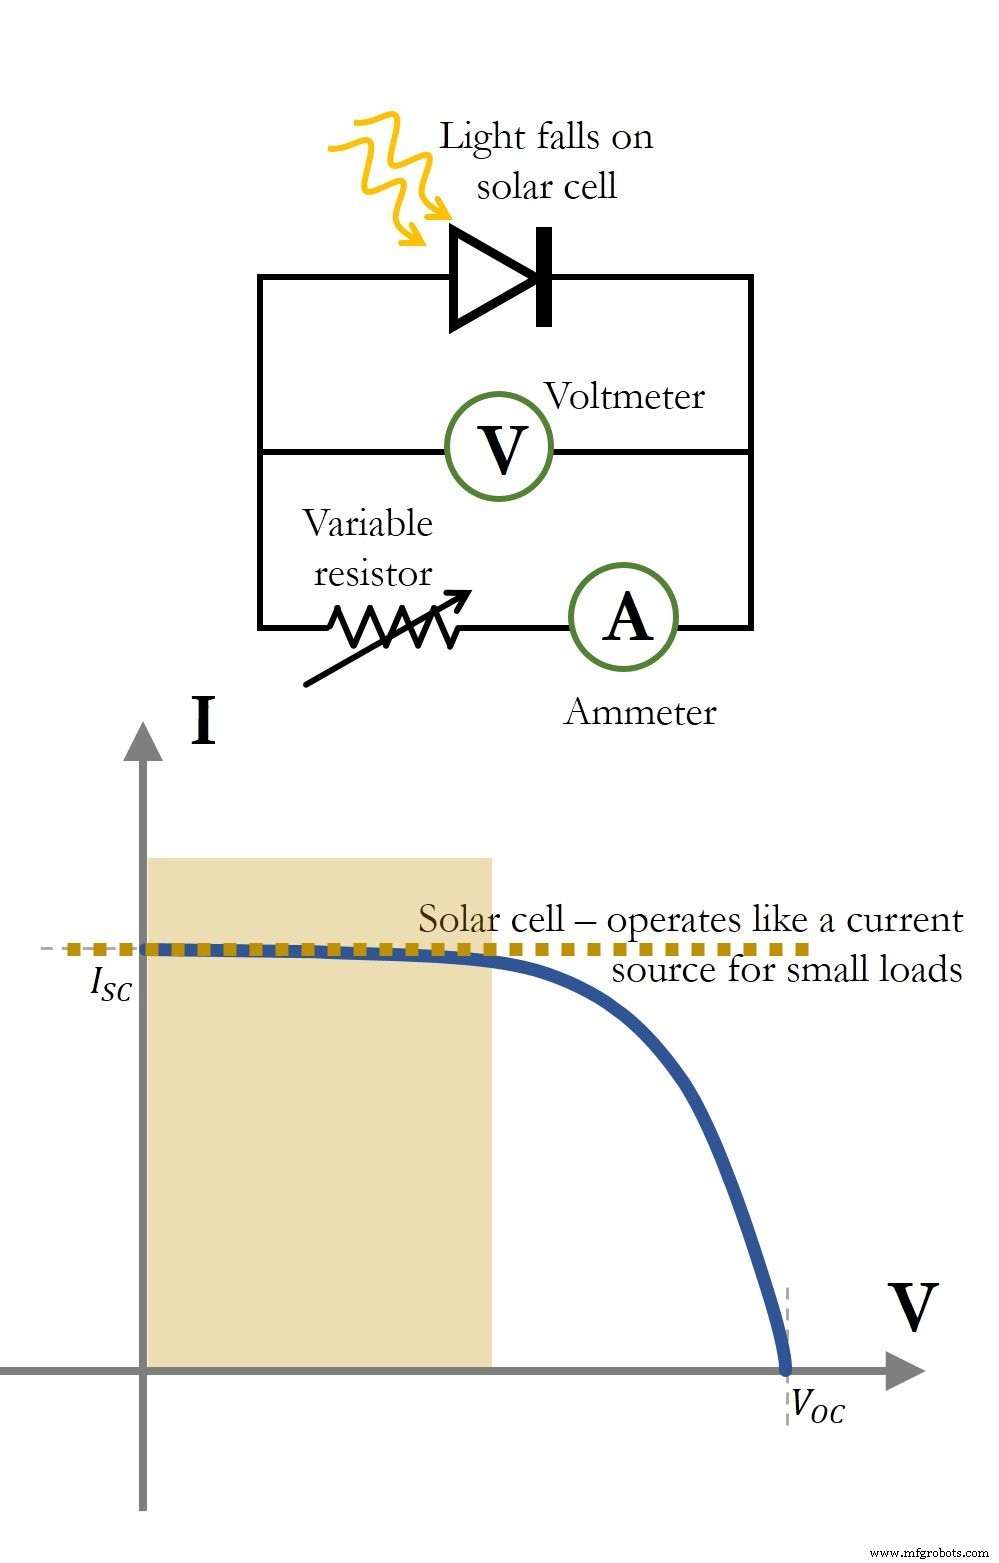
Figure 1. Schematic of an I‑V measurement circuit for a solar cell under fixed illumination (top) and a representative I‑V curve (bottom). The short‑circuit current, $I_{SC}$, and the open‑circuit voltage, $V_{OC}$, are indicated. For low load resistances the cell behaves nearly as an ideal current source.
At a short‑circuit (0 Ω), the cell delivers its maximum current, $I_{SC}$. At an open‑circuit (∞ Ω), no current flows and the voltage equals $V_{OC}$. The curve shows that small loads mimic a current source, whereas large loads reveal the device’s voltage‑generation capability.
I‑V Curves of Batteries
A battery—an assembly of electrochemical cells—converts chemical energy into electrical energy. Batteries are specified by voltage and capacity (Ah), depending on their chemistry (e.g., Ni‑Cd, Li‑Ion).
The I‑V characteristic is measured using the same load‑switching approach, as depicted in Figure 2.
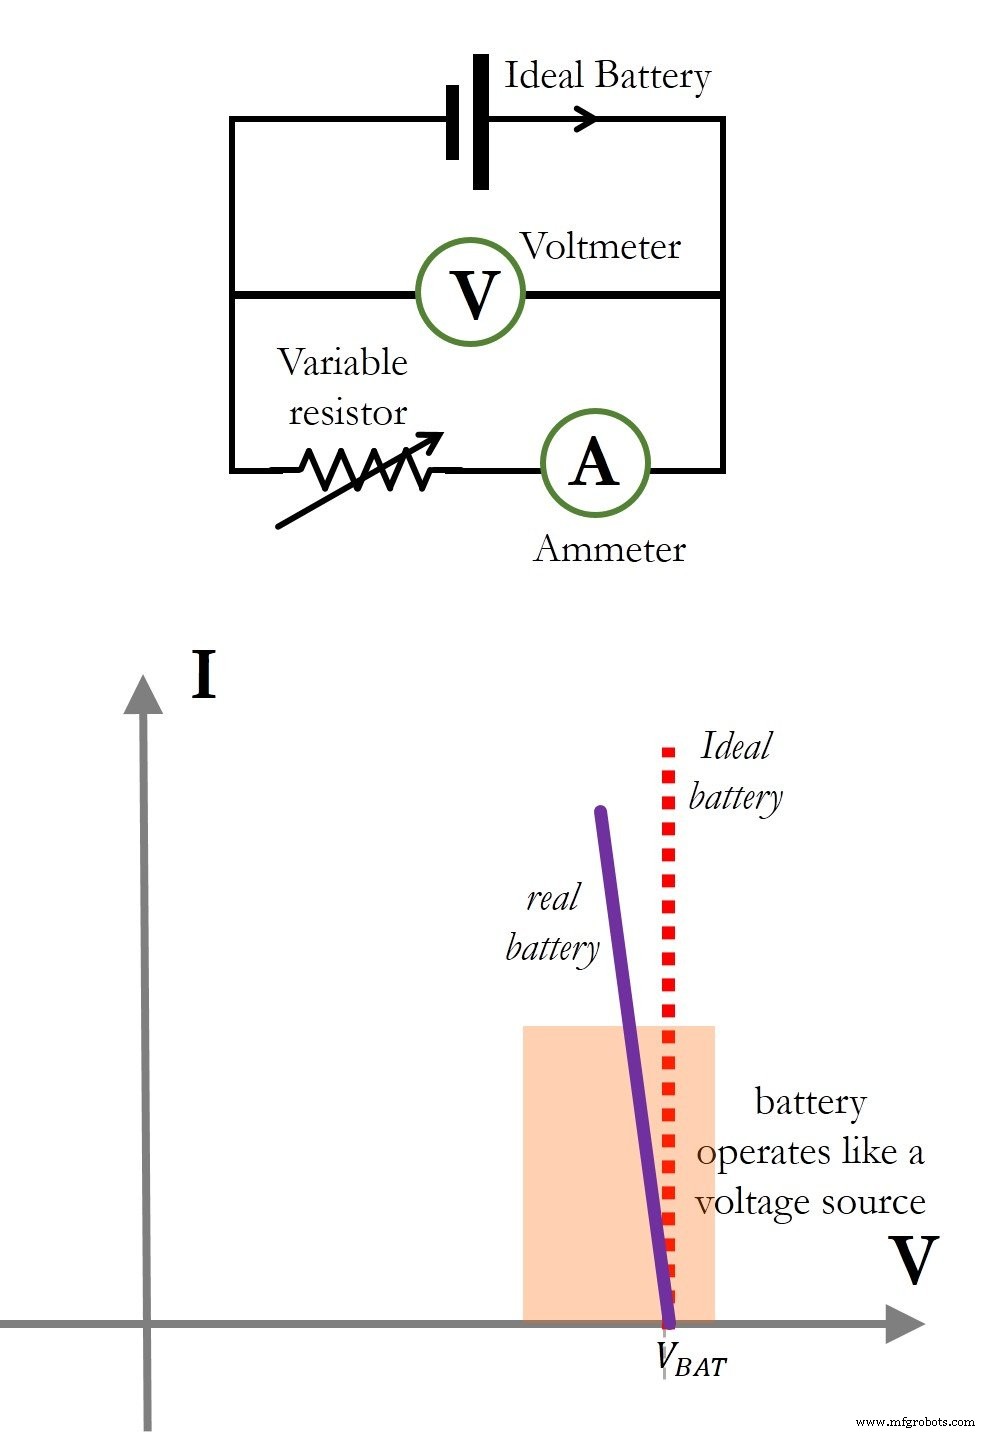
Figure 2. Load‑switching measurement of an ideal battery (top) and the resulting I‑V curve for an ideal battery alongside a typical real battery (bottom). Real batteries are modeled as an ideal voltage source in series with an internal resistance, reflected by the slope.
An ideal battery behaves as a perfect voltage source. A functional real battery exhibits a slight voltage drop with increasing load, represented by the slope in the figure. The non‑zero intercepts of these curves confirm that batteries store energy internally.
I‑V Curves of New Materials
We have examined ideal linear components—resistors, capacitors, inductors—as well as active devices like solar cells and batteries. Historically, devices such as diodes and solar cells were considered novel; their I‑V data were used to model them with linear elements. Understanding I‑V behavior helps engineers uncover new applications for emerging materials.
Neural Stimulation Electrode
An electrode is a conductive interface that contacts a non‑metallic part of a circuit. In electrochemistry, cyclic voltammetry (CV) is the standard technique for probing the I‑V response of electrode materials by sweeping the potential and recording the resulting current.
CV captures the voltages at which electrochemical reactions dominate and is sensitive to the sweep rate. For details on CV, see dedicated resources.
Typical CV experiments employ a three‑electrode setup: the working electrode (e.g., iridium oxide) immersed in an electrolyte (NaCl), a platinum counter electrode, and a reference electrode. Figure 3 presents a representative CV curve.
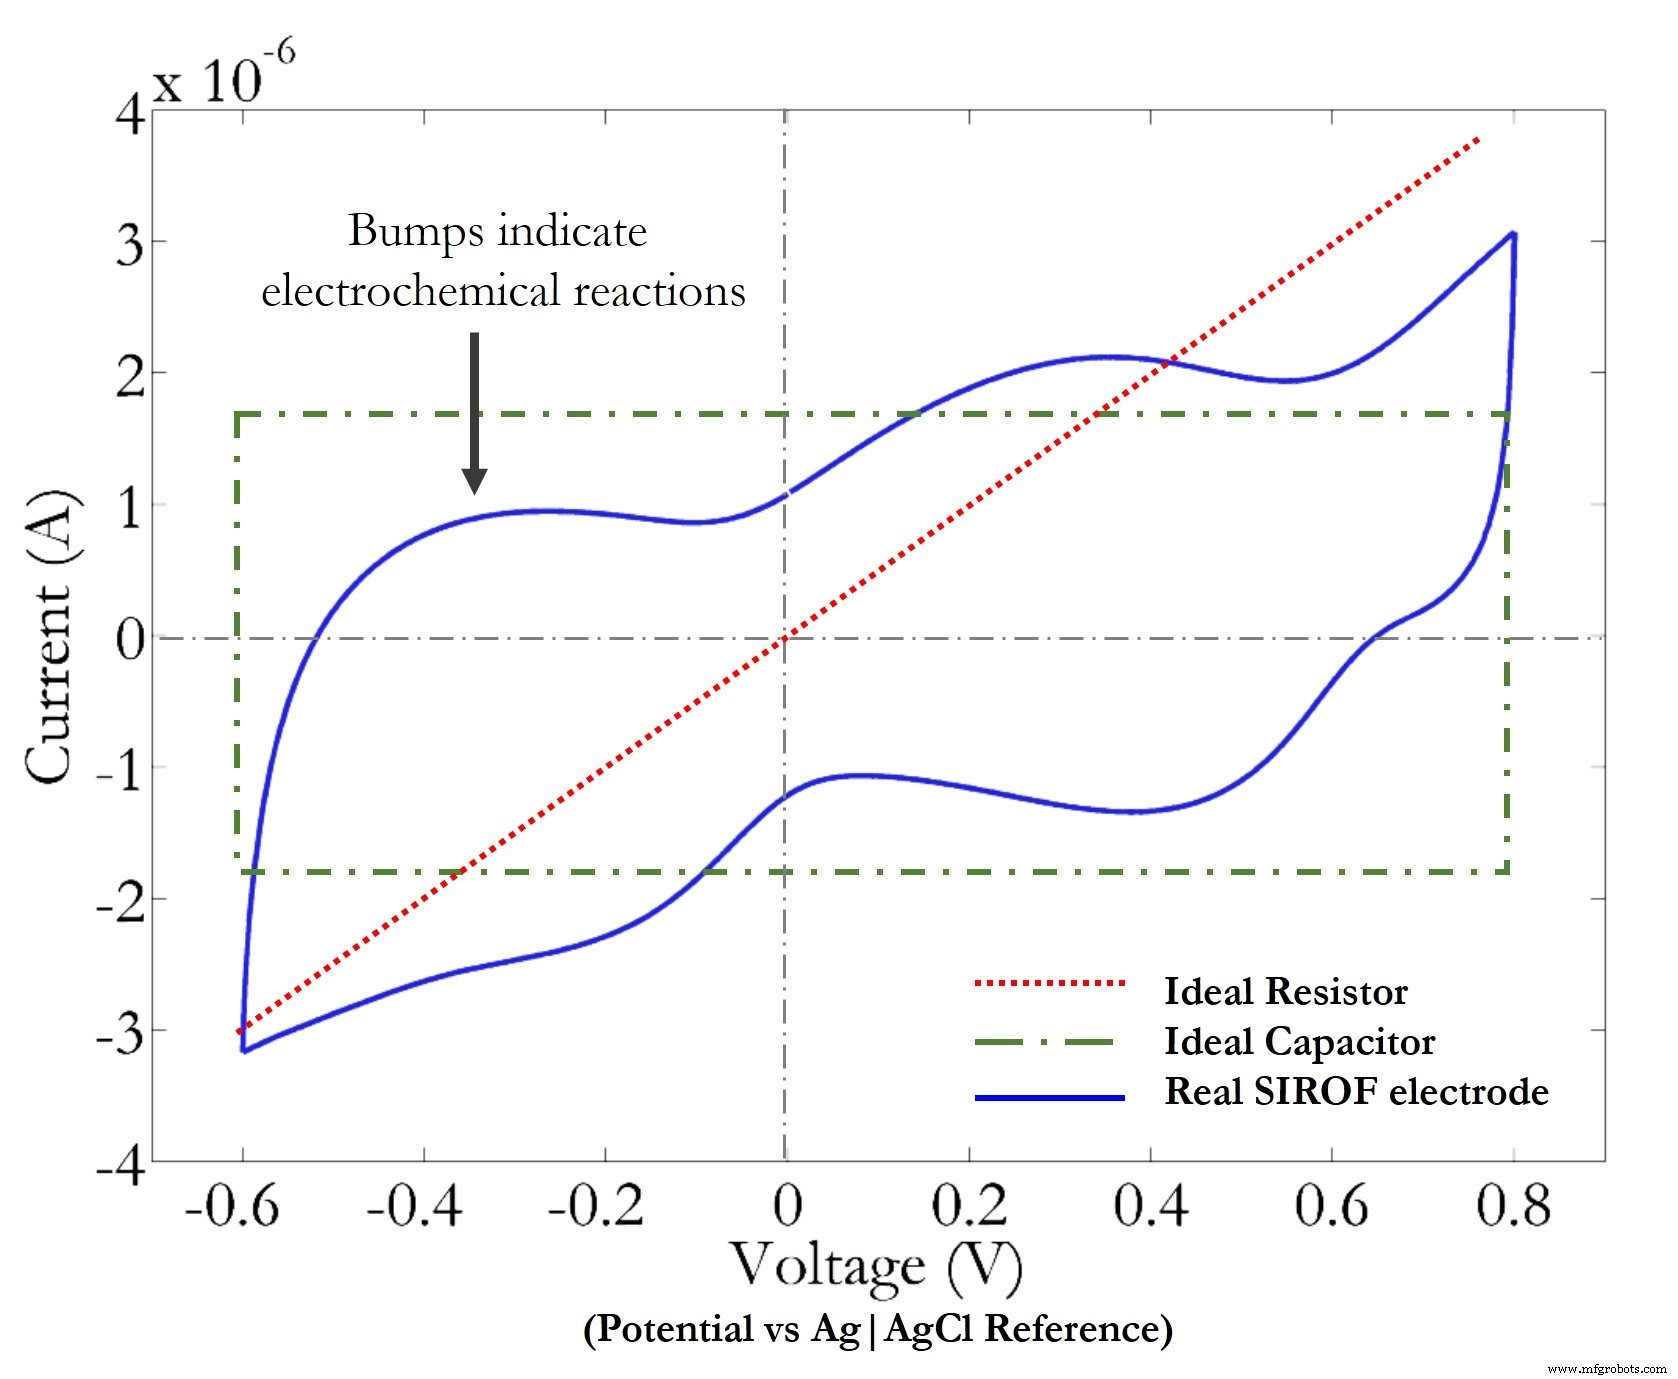
Figure 3. I‑V curve of an iridium‑oxide electrode in saline (blue). Overlaid are the responses of a capacitor and a resistor, illustrating the electrode’s capacitive charge‑storage behavior and hysteresis.
Summary of Interpreting I‑V Curves of Different Materials
| Device | Requires Power? | I‑V Method | Common Use | Passes Through Origin? |
| Solar Cell | No | Load Switching | Current source for low loads | Yes |
| Battery | No | Load Switching | Voltage source for high loads | Yes |
| Stimulation Electrode | Yes | Voltage Sweep (CV) | Capacitive charge injection into tissue | No |
Industrial equipment
- Photovoltaic Performance of GaSe/MoSe₂ Vertical Heterojunctions: Insights from 2‑D Semiconductors
- Exploring 8 Key Tech Trends of 2021 with Real-World Examples
- 14 Key Mechanical Properties of Materials: A Practical Guide
- Choosing the Right Cutting Tool Materials for Optimal Machining Performance
- SensiCut: Advanced Laser Cutter Platform Accurately Identifies Materials
- Explore the Variety of Textile Raw Materials: Natural & Synthetic Fibers Explained
- Exploring the Key Categories of Industrial Raw Materials
- Exploring the Three Core Types of Agricultural Raw Materials
- Choosing the Right Investment Casting Materials: Types, Benefits, and Applications
- Key Mechanical Properties of Materials: A Comprehensive Overview