


Are Your Yield and Defect Rates Truly Reflecting Shift Performance?
Quality is the cornerstone of any high‑performance operation. By accurately measuring yield and defect rates across worker shifts, you can pinpoint productivity gaps, set realistic expectations, and align individual targets with corporate objectives.
These metrics also expose workflow slow‑downs and pinpoint bottlenecks, enabling targeted interventions that drive measurable improvements.
 What if you had?
- Access to worker shift performance reports that deliver accurate yield, quality, and defect rates in real time.
- A detailed Root Cause Analysis highlighting quality concerns at every stage of each shift.
- A comprehensive Process Behaviour Chart that benchmarks operational stability against industry best practices.
ThroughPut’s AI‑enabled Operational Excellence Product ELITE is engineered to prioritize shift focus and resource allocation, accelerating output gains. ELITE digs deeper into performance data to surface core inefficiencies and surface actionable insights.
ELITE helps you answer
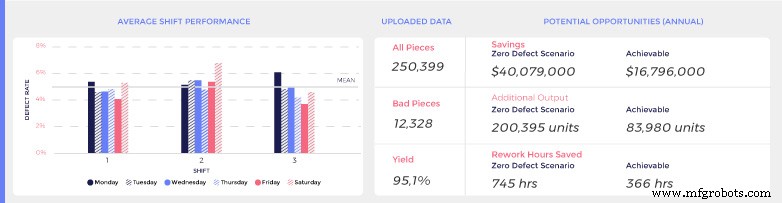
- What does the average shift performance graph reveal?
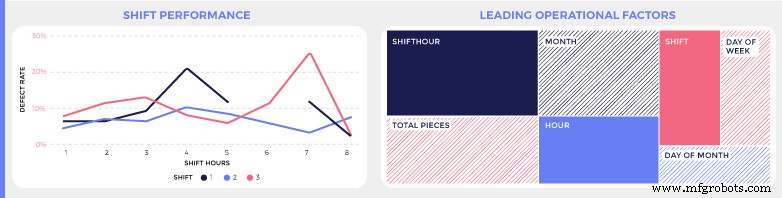
- What is the potential for yield improvement and defect reduction, and what root causes drive current inefficiencies?
- Where should you reallocate resources to address these root causes most effectively?
- Which time periods yield the smoothest operations?
- Which shift intervals show the lowest defect rates?
Here is how it works?
By inputting a few key details about your existing operational shift quality data, ELITE delivers an accurate analysis of worker productivity performance:
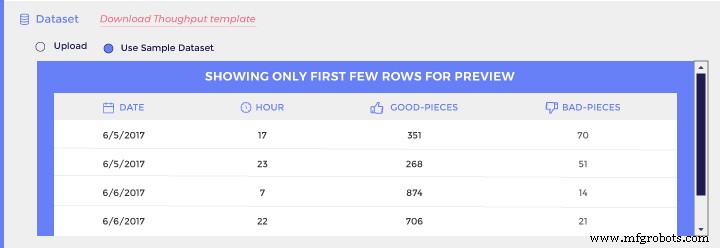
INPUT
Step 1 – Upload your existing dataset containing hourly logs of good versus bad pieces.
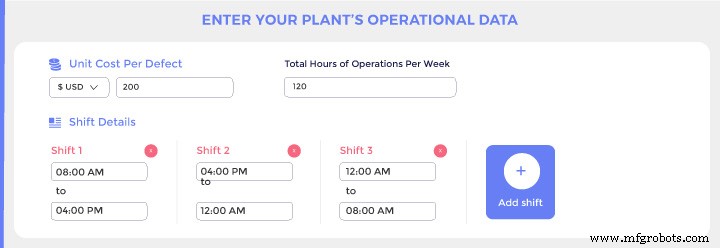
Step 2 – Enter your plant’s operational data: total cost per defect, weekly operating hours, and shift details.
ANALYZE YOUR OPERATIONS – THE OUTPUT
- Analyze the Average Shift Performance alongside the Average Defect Rate to identify baseline performance.
- Visualize Shift Performance to track defect‑rate trends across all shifts.

Industrial Technology
- 5 Powerful Shift‑Analysis Reports to Drive Quality and Efficiency
- How Tracking Software Enhances Worker Safety and Prevents Fines
- Elevate Your Career: 4 Proven Strategies to Boost Job Performance
- Transform OEE into a Leading Financial KPI for Your Business
- Maximize Asset Management: 5 Proven Strategies to Leverage Asset Tags with Tracking Software
- Boost Manufacturing Workforce Efficiency with Proven Strategies and Tech Solutions
- Optimize Maintenance Management with Advanced Equipment Tracking Software
- Asset Tracking Software: Accurate Real‑Time Asset Location & Management
- 5 Red Flags That Indicate Information-Sharing Issues in Your Plant
- Accurately Assess Your Procurement Project Results