


5 Powerful Shift‑Analysis Reports to Drive Quality and Efficiency
Managing quality across multiple shifts and factory sites can feel like juggling invisible dice. In fact, recent research shows operations managers spend an average of 3.14 hours each week drafting work schedules, with 20% of their time devoted to this task alone. The cost? Manual schedule creation not only inflates effort by 140 hours annually, but also increases employee turnover by a staggering 174% due to scheduling errors. These inefficiencies ripple into higher operating costs, lower revenue, and growing worker grievances.
Imagine having real‑time, shift‑level data at your fingertips—ready to inform weekly huddles, spotlight critical bottlenecks, and prioritize resources for maximum output. ThroughPut’s ELITE Analytics‑Enabled Operational Excellence product turns your existing defect data into actionable insights, eliminating the guesswork and manual grunt work that hold back your plant.
Below are five targeted reports that slice and dice your defect data to reveal the complete picture and guide you toward better output, productivity, and profitability.
Report 1: Average Shift Performance
This report benchmarks the average defect rate across all shifts over a chosen period (week, month, or quarter). By highlighting which shift exceeds the baseline, managers can immediately focus corrective actions on the most problematic times.
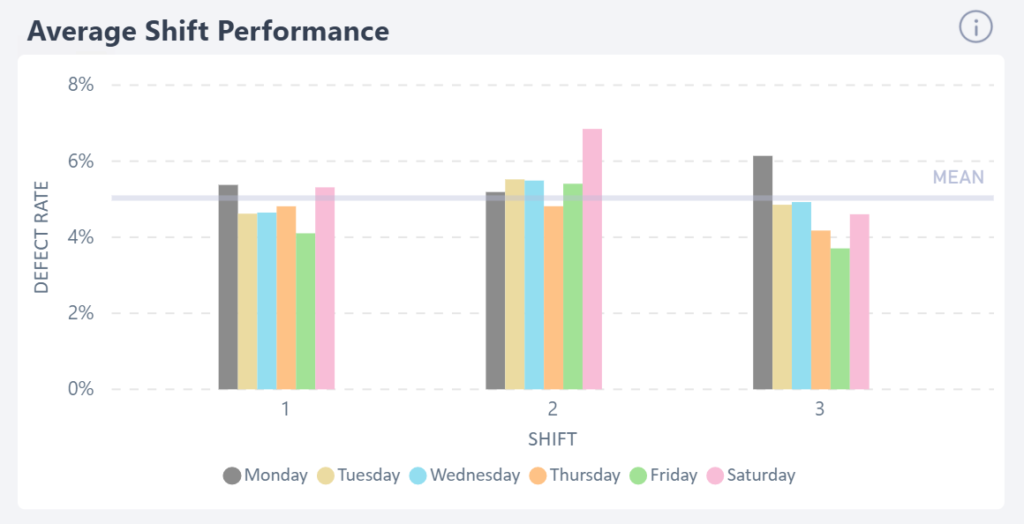
Use it to allocate resources strategically—prioritizing shifts and days that contribute most to defect rates.
Access: Available on the Free Trial Version
Report 2: Shift Performance by Hour
Track the rate of change in defect behavior hour‑by‑hour across all shifts. Peak defect periods are highlighted, guiding managers to investigate and mitigate root causes where they matter most.
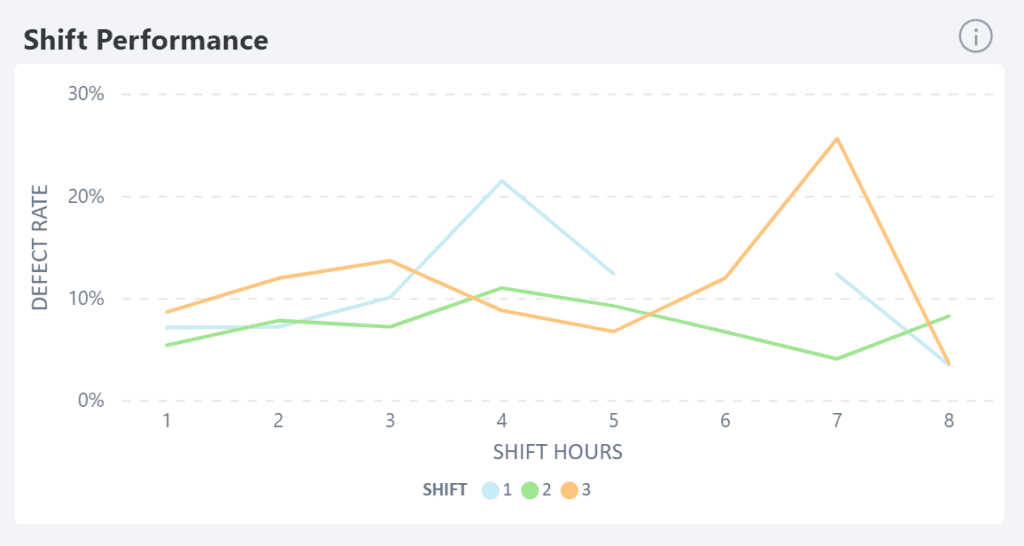
Evaluate hourly performance to eliminate peaks that threaten overall quality.
Access: Available on the Free Trial Version
Report 3: Root Cause Analysis
Predict the underlying causes of quality concerns for each shift. This forward‑looking analysis helps managers pinpoint specific issues before they snowball.
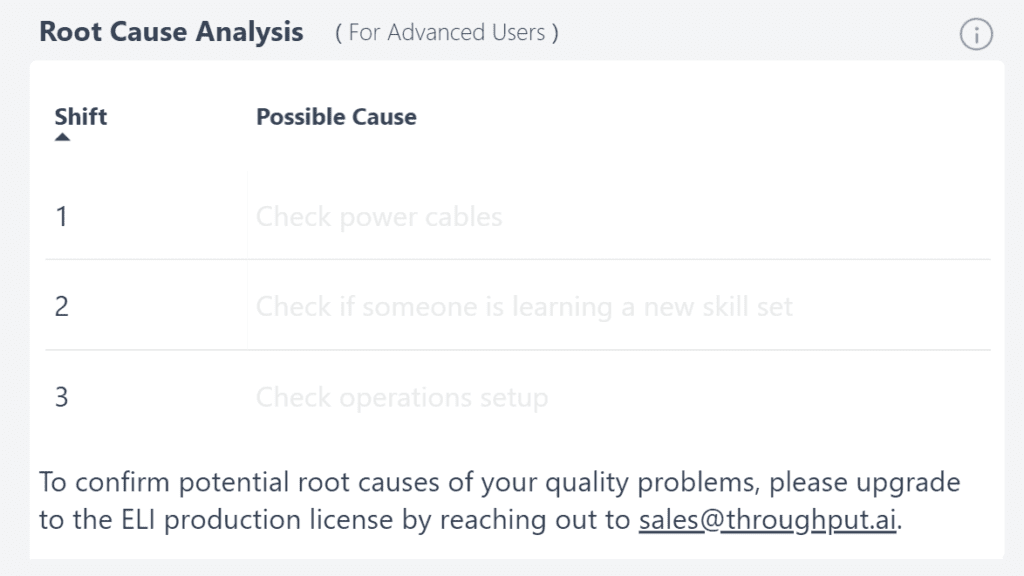
Identify and address root causes with precision.
Access: Available on the Enterprise Version (ELI)
Report 4: Leading Operational Factors
Discover which operational variables most strongly influence bottlenecks and root‑cause accuracy. ELITE performs a multivariate derivative and correlation analysis to surface the highest‑impact factors.
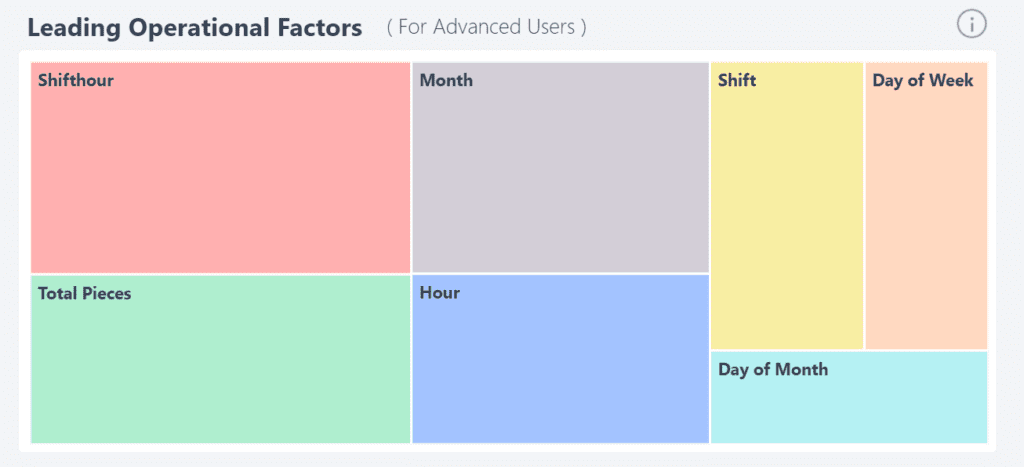
Track these factors to refine your improvement roadmap.
Access: Available on the Enterprise Version (ELI)
Report 5: Process Behaviour Chart
Analyze defect rates using rigorous statistical methods. Benchmark performance against industry best practices and internal historical data to gauge stability and consistency.
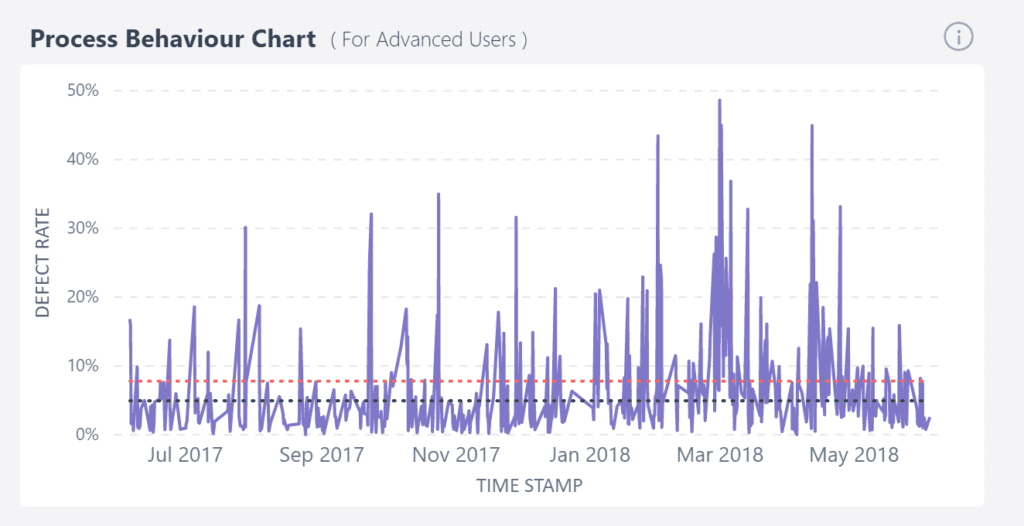
Monitor process health in real time and intervene before quality degrades.
Access: Available on the Enterprise Version (ELI)
Start leveraging these reports to gain a crystal‑clear view of your operations’ quality. Activate your free trial today and witness transformational results across your plant.

Industrial Technology
- Are Your Yield and Defect Rates Truly Reflecting Shift Performance?
- Three Key Challenges Every Business Incubator Must Overcome
- Overcoming the Top Seven Last‑Mile Delivery Challenges: Proven Solutions for Faster, Cost‑Effective Shipping
- How Vibration Analysis Drives Predictive Maintenance Success
- Why Oil Analysis Is Crucial for Equipment Reliability
- 5 Proven Strategies to Optimize Your Supply Chain
- Proven Strategies for Reliable Manufacturing Machine Maintenance
- Cut Costs, Not Quality: 5 Proven Ways to Reduce Manufacturing Expenses
- PI-Hole: Comprehensive Network-Wide Ad Blocking & Privacy Protection
- Master Product Design with Subtractive Manufacturing: Precision, Cost‑Effectiveness & Reliability