


10 Essential Maintenance Metrics That Drive Better Decision‑Making
Over the past decade, maintenance analytics has evolved dramatically. Advanced sensors, real‑time dashboards, and predictive algorithms now give us a richer, more accurate data set than ever before. Yet, many facilities still rely on the same handful of legacy metrics—OEE, MTTR, and similar figures—that were developed when data collection was far more limited.
Traditional metrics can mislead. They often suffer from bias, lack context, and ultimately provide little actionable insight. The result? Maintenance teams spend time on tasks that don’t directly support production, and decision‑makers struggle to justify budget increases.
To bridge that gap, we’ve compiled ten metrics that are rarely listed together in industry resources but are proven to deliver measurable value. Each metric is explained, along with practical ways to embed it into your maintenance program.
10 Maintenance Metrics for Better Analysis
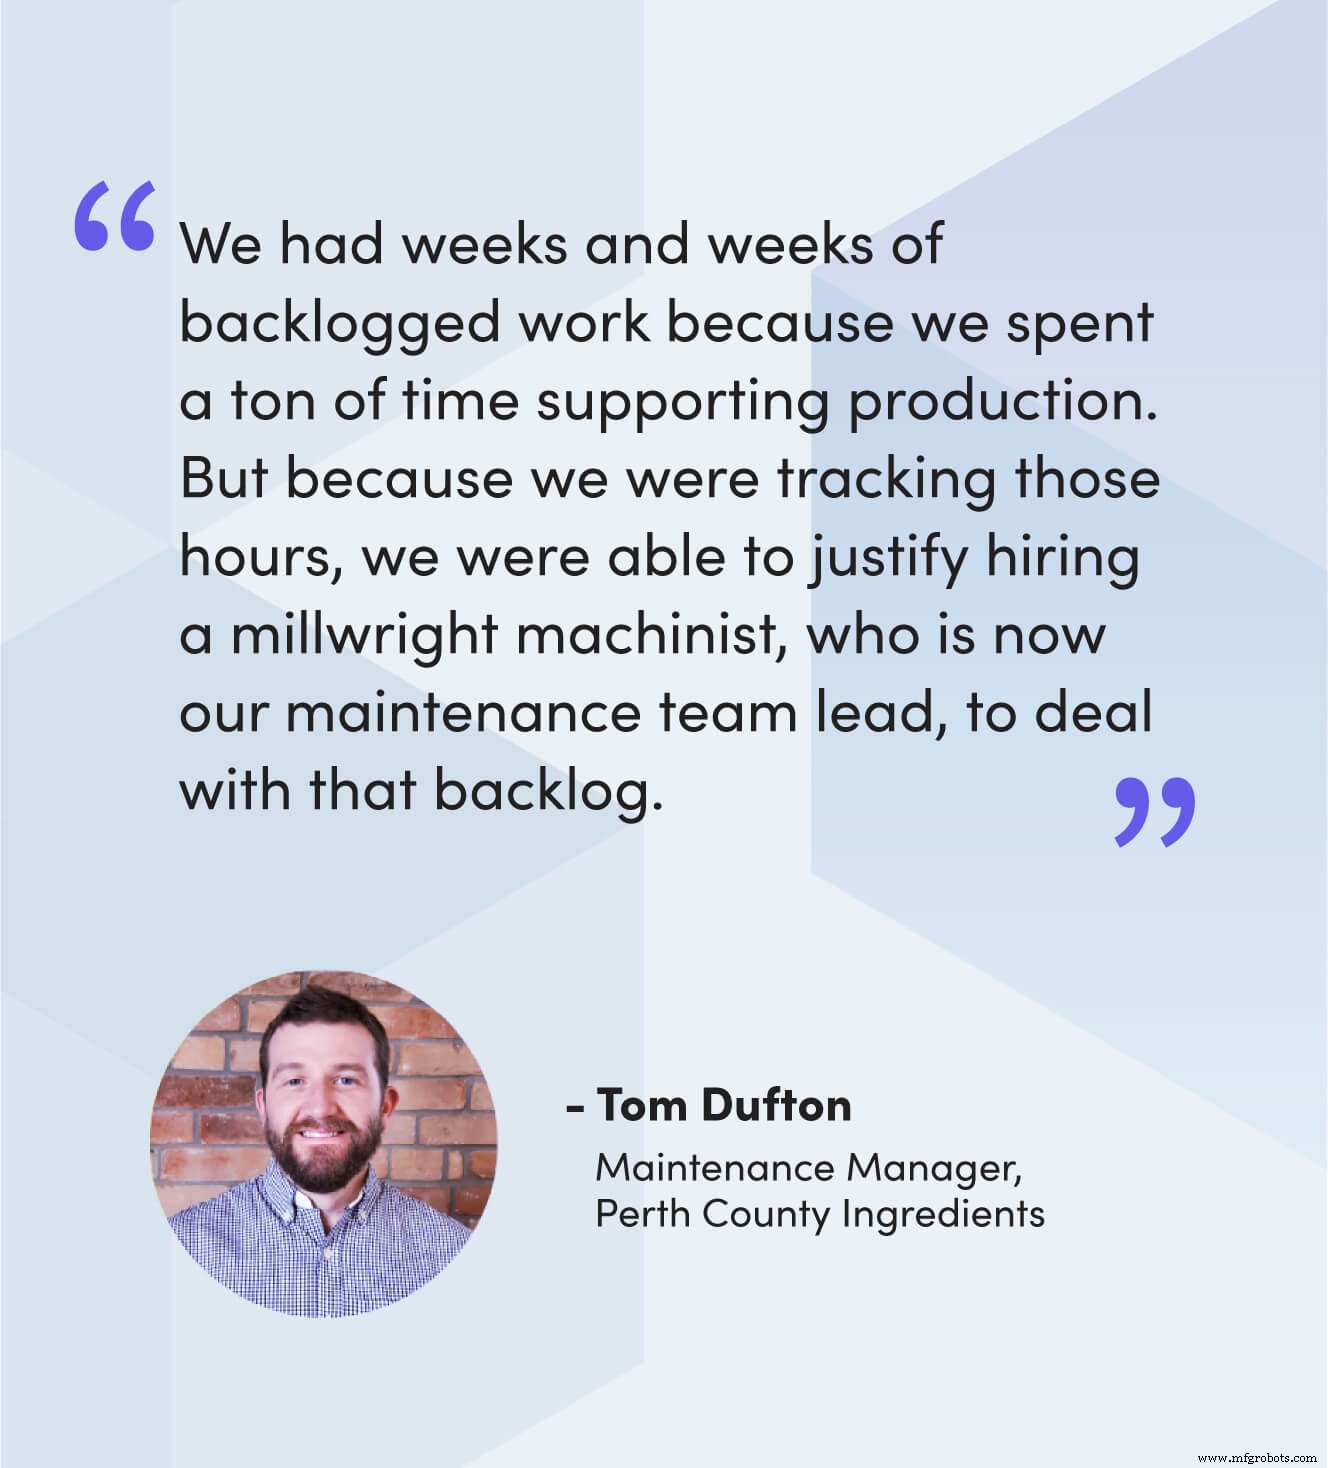
#1 – Time Spent Supporting Production
What it measures: The cumulative hours the maintenance crew dedicates to production‑centric activities, tracked weekly, monthly, or quarterly.
Why it matters: When “once‑in‑a‑while” support tasks become daily, the maintenance backlog swells. Monitoring this metric lets you spot the tipping point early, reallocate resources, and build a business case for additional staff or cross‑training programs that empower operators to handle minor issues.
#2 – Follow‑Up Work Created After Inspections
What it measures: The count of corrective work orders generated from routine inspections, measured monthly, quarterly, or annually.
How to use it: Segment the data by machine, shift, or site to uncover performance trends. More importantly, analyze by task to identify recurring failures. A high frequency of follow‑ups after a specific inspection indicates the schedule is effective; a low frequency suggests you can safely extend intervals, saving labor and parts without elevating risk.
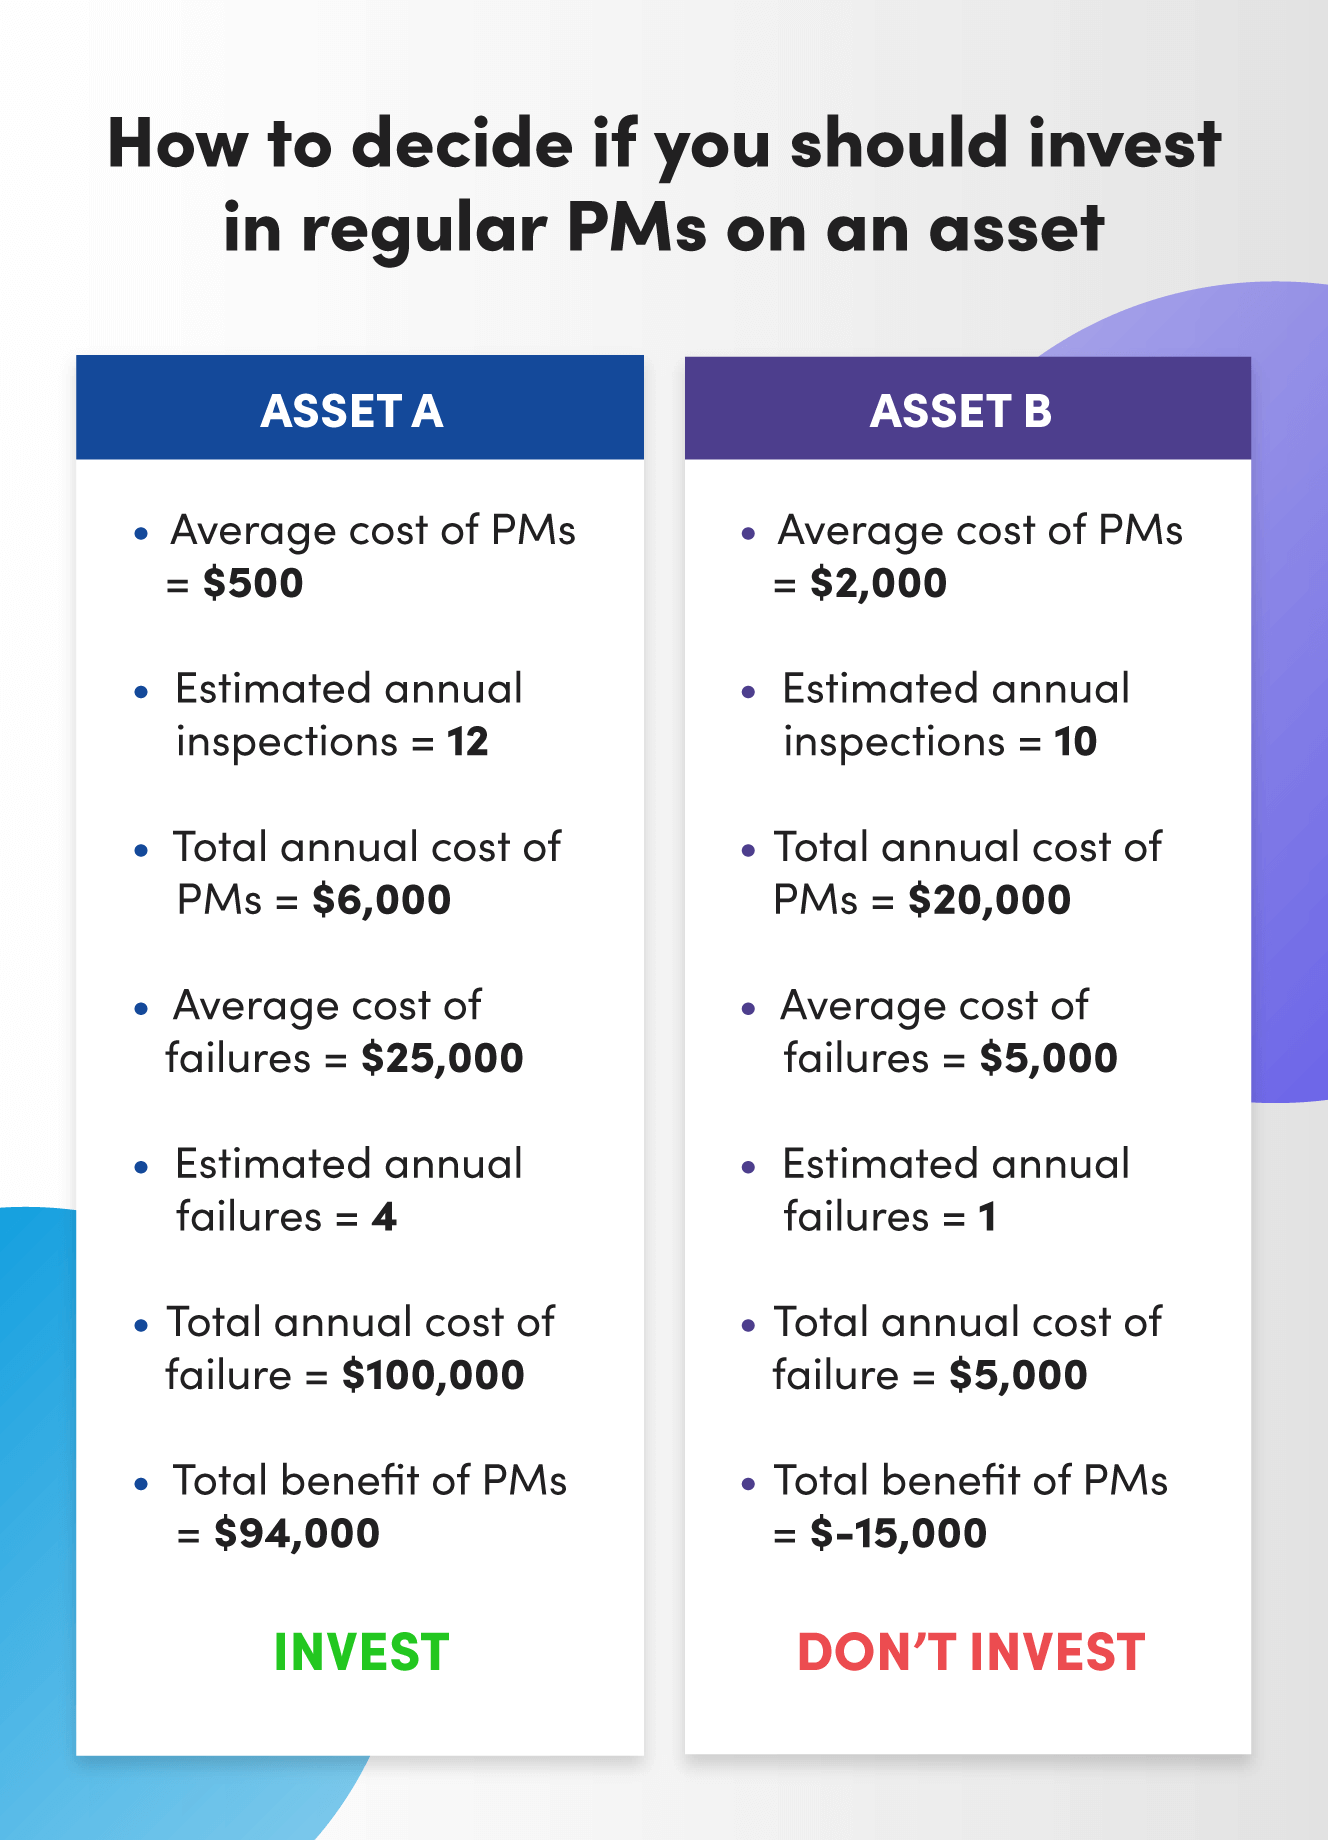
#3 – Cost of Follow‑Up Maintenance vs Expected Cost of Total Failure
What it measures: The ratio of corrective maintenance expenditures (labor and parts) to the projected cost of an asset failure (lost production, overtime, replacement parts).
How to use it: If routine inspections cost more than a single failure event, a run‑to‑failure strategy may be more economical for that asset. Conversely, a lower cost of preventive work signals a strong return on investment. This metric also guides backlog prioritization and budget allocation.
#4 – Cost by Maintenance Type
What it measures: Total maintenance spend—labor and parts—broken down by preventive, emergency, and follow‑up categories, typically recorded monthly, quarterly, or annually.
How to use it: Elevated costs often point to process inefficiencies. For example, unclear work orders can inflate labor hours; outsourcing emergency repairs may signal a skills gap. Use the data to refine SOPs, provide targeted training, or adjust staffing levels.
#5 – Clean Start‑Ups After Maintenance
What it measures: The number of production lines that begin without stoppages or scrap immediately after maintenance, tracked monthly, quarterly, or annually.
How to use it: This metric ties maintenance quality directly to output. Low clean start‑up rates may reveal outdated specifications, misaligned tolerances, or incomplete procedures. Addressing these root causes can boost yield and reduce downtime.
#6 – Size of Backlog
What it measures: Total hours of overdue and scheduled maintenance tasks, monitored weekly and monthly.
How to use it: Quantify the gap between available labor hours and the backlog. A large disparity indicates a need for overtime, additional hires, or contract support. Presenting this data strengthens your budget request.
#7 – Top 10 Assets by Downtime
What it measures: The equipment that experiences the most frequent or longest downtimes, reviewed weekly, monthly, and quarterly.
How to use it: Visibility drives action. By highlighting high‑impact assets, you can allocate resources to root‑cause analysis, component replacement, or process changes. This focused approach often leads to significant reliability gains and justifies capital investments.
#8 – Planned Maintenance Percentage (Last 90 Days)
What it measures: The proportion of scheduled maintenance relative to all maintenance activity over the past 90 days.
How to use it: This metric tracks the transition from reactive to proactive work. A decline may signal a major breakdown or seasonal production surge. Use the insight to refine request workflows or adjust inspection intervals, and tie improvements to strategic goals.
Learn more about planned maintenance percentage and how to improve it
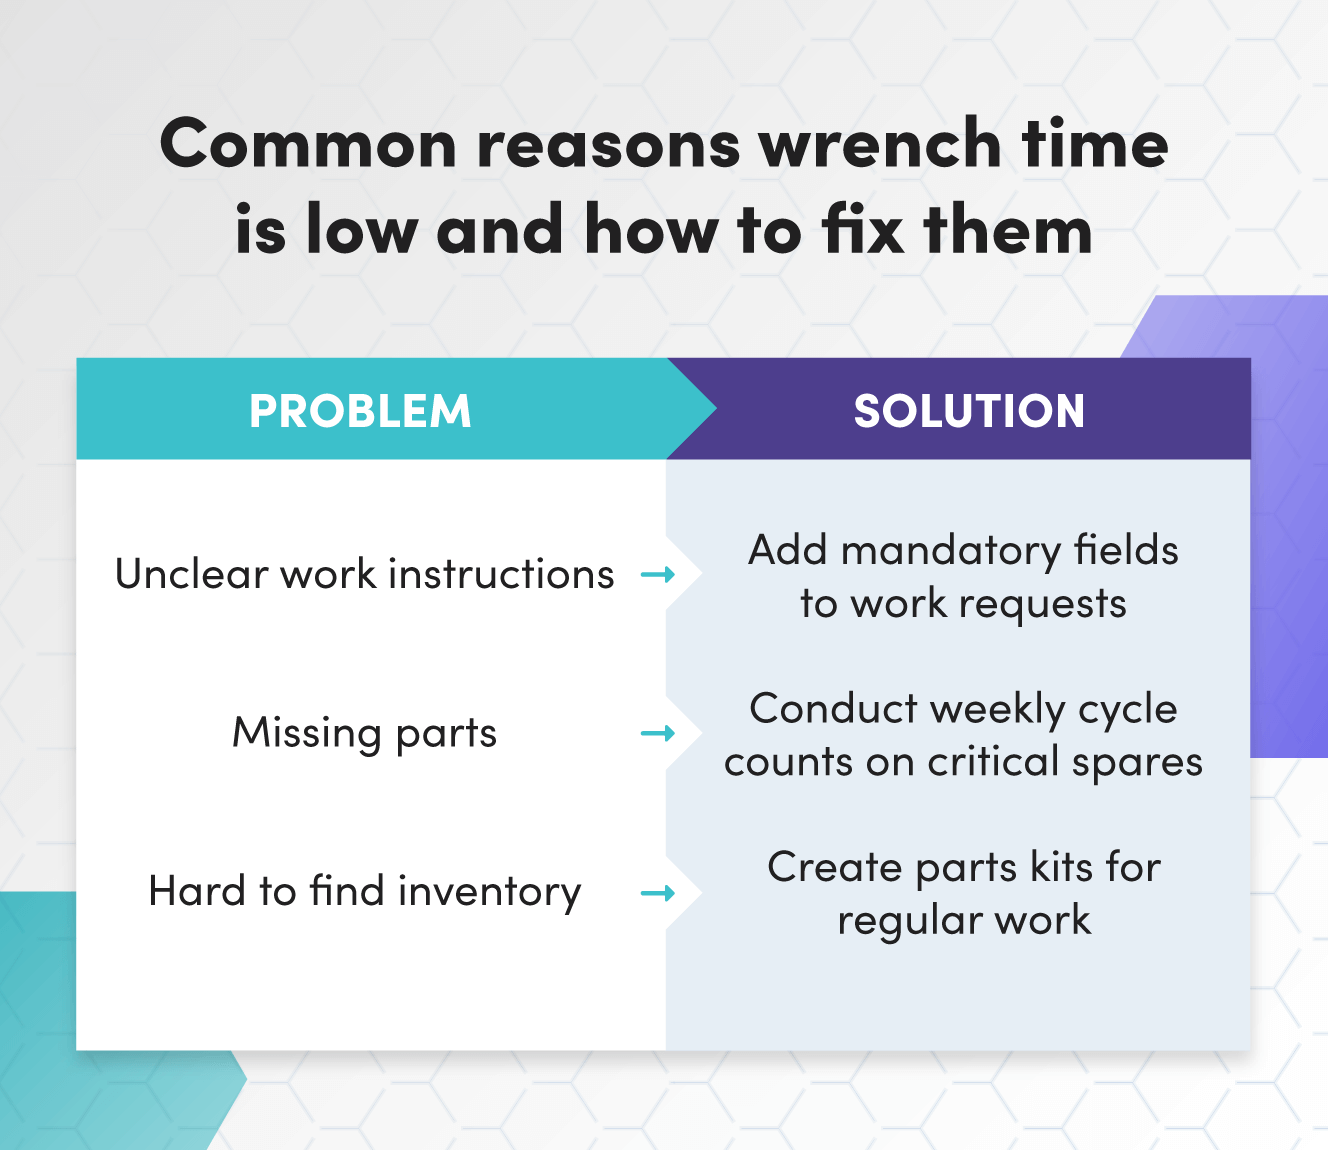
#9 – Wrench Time (Last 90 Days)
What it measures: The amount of technician labor dedicated to a job versus the total time required to complete it, averaged by job or aggregated monthly, quarterly, or yearly.
How to use it: Rather than blaming technicians for low wrench time, investigate process bottlenecks. Identify jobs with unusually short times, dissect the steps, and eliminate unclear instructions or missing tools. This leads to higher productivity and lower backlog.
#10 – Health and Safety Work Orders Completed
What it measures: The number of safety or compliance work orders finished, recorded monthly, quarterly, or annually.
Why it matters: While often qualitative, this metric directly influences workplace safety, audit readiness, and morale. A high completion rate correlates with fewer incidents and lower regulatory risk.
Three Strategic Goals Achievable with These Metrics
Secure a Larger Maintenance Budget and More Time
Key metrics:
- Cost by Maintenance Type
- Clean Start‑Ups After Maintenance
- Top 10 Assets by Downtime
Align your proposal with business objectives. Demonstrate how preventive spending curbs costly emergency repairs—one $250,000 incident can be avoided. Use clean start‑ups data to show direct productivity gains. Highlight the high‑downtime assets as a clear ROI driver for additional resources.
Get a template for pitching your next big (and expensive) maintenance project
Drive Team Buy‑In for Change
Key metrics:
- Planned Maintenance Percentage (90 Days)
- Wrench Time (Last 90 Days)
- Follow‑Up Work Created After Inspections
Change resistance fades when teams see tangible improvement. Compare pre‑ and post‑implementation data: fewer reactive jobs, longer wrench times indicating thorough work, and fewer follow‑ups after inspections. These numbers illustrate how new processes directly reduce frustration and workload.
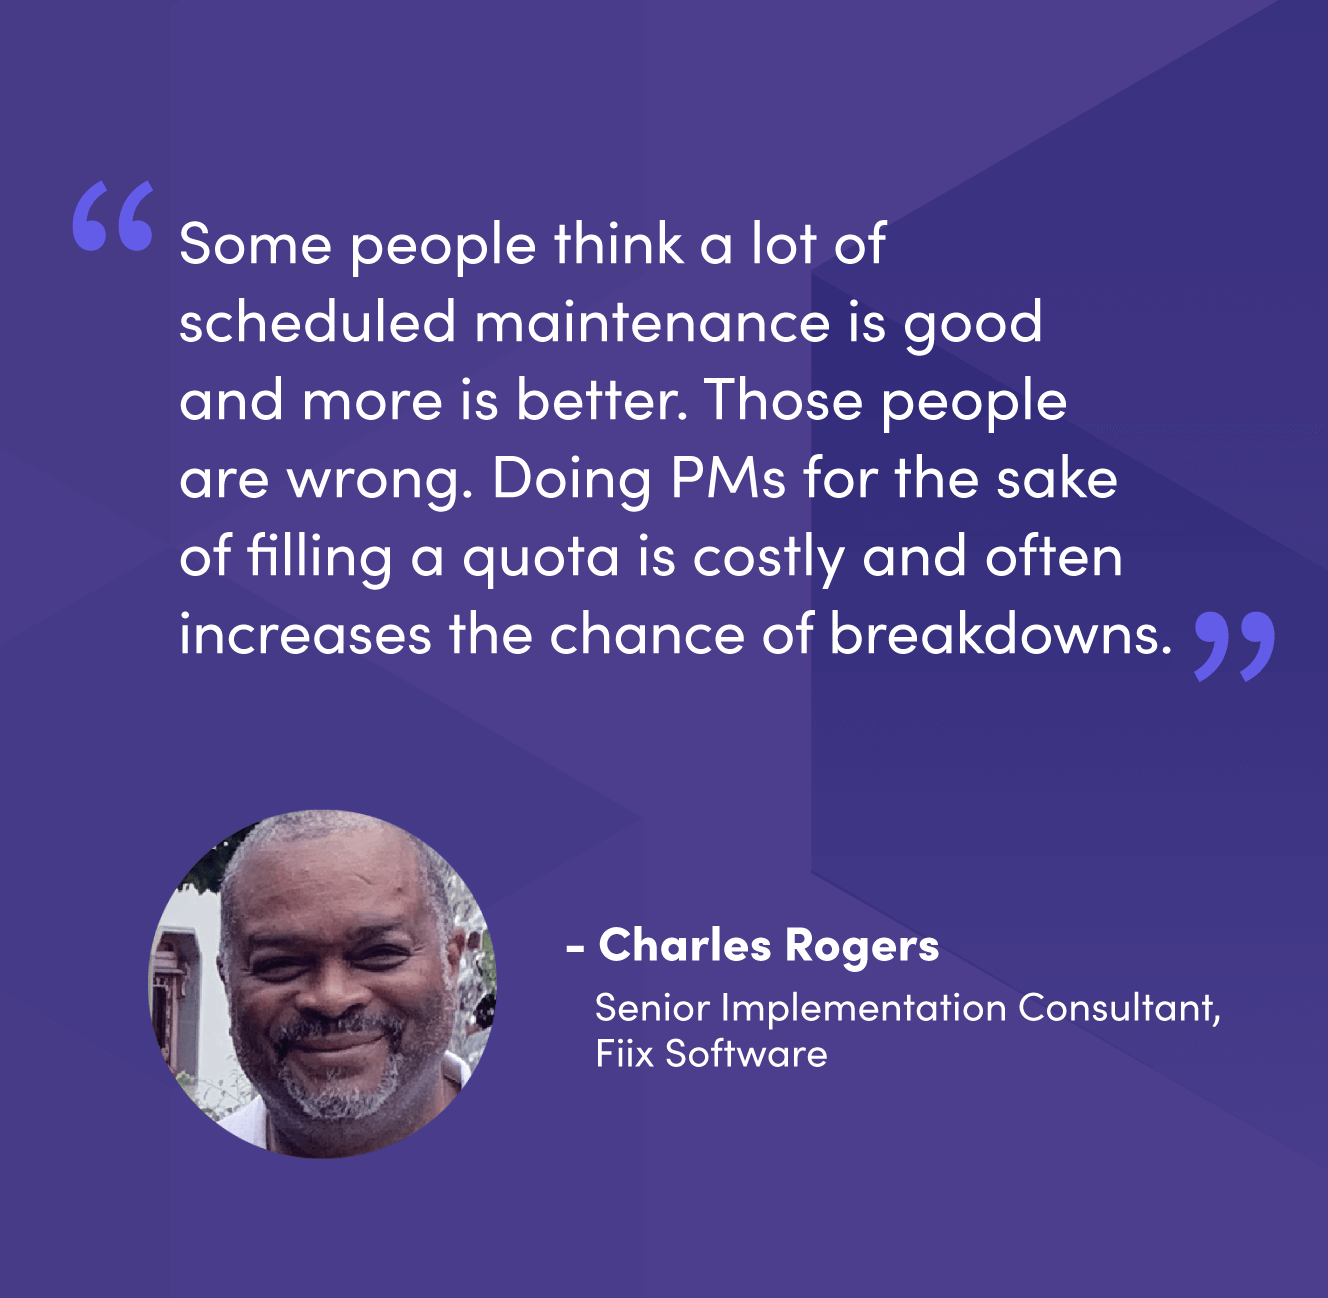
Build a Benchmark‑Setting Preventive Maintenance Program
Key metrics:
- Cost by Maintenance Type
- Follow‑Up Work Created After Inspections
- Cost of Follow‑Up Maintenance vs Expected Cost of Total Failure
Efficiency, not volume, defines excellence. Use cost data to allocate resources to high‑value preventive tasks. Monitor follow‑ups to fine‑tune inspection frequency—extend intervals when no corrective work emerges. Compare preventive costs against potential failure losses to confirm that every dollar spent yields a net benefit.
The Future of Maintenance Analysis is Dynamic
Effective metrics have purpose, consistency, and a clear link to decisions. They evolve as your organization grows and as new data sources become available. Regularly review each metric’s relevance, adjust targets, and share insights across departments. When maintenance data speaks to the priorities of production, finance, and safety, you build a program that others will envy.
Equipment Maintenance and Repair
- How Predictive Maintenance Drives Significant Cost Savings for Manufacturers
- Mastering Maintenance Inventory Management: Strategies to Cut Costs and Boost Reliability
- How to Reduce Maintenance Costs Without Sacrificing Reliability
- Streamline Maintenance to Boost Plant Efficiency
- Operational Practices That Drive Reliability
- Elevating Maintenance: Aligning Strategy, Building Trust, and Driving Business Value
- Is Your Plant Operating Like a Navy Carrier? Insights for Optimizing Teamwork
- Top CMMS Integrations to Accelerate Your Maintenance Program
- 3 Proven Strategies to Elevate Your Industrial Equipment Maintenance Plan
- Boost Your Business with 6 Proven Equipment Management Software Strategies