


How to Quantify the Hidden Cost of Reliability Failures
What is the true cost of a failure? The answer often surfaces only after the event has occurred, yet reliability engineering is fundamentally about preventing those events. The challenge for manufacturers is to determine the value of a non‑event – the savings achieved by averting a failure.
Reliability professionals typically excel in deterministic, parametric analysis. To anticipate future outcomes under current conditions and justify investments that create a safer, more profitable future, they must adopt a probabilistic, non‑parametric mindset.
We know two facts: every manufacturing process will eventually fail, and each failure will impact the organization. What remains uncertain is the timing of the failure and the severity of its impact.
Reliability experts often fall into two extremes when estimating impact. A conservative engineer may only account for the cost of spare parts, treating labor as sunk and ignoring downtime or risk‑based costs such as injury or environmental damage. Conversely, an overly aggressive engineer might predict a catastrophic scenario where an undetected bearing failure leads to a plant shutdown, fire, environmental disaster, and even global catastrophe. The truth lies somewhere between these extremes.
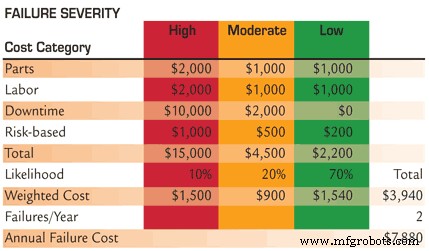
Figure 1. The true cost of failure cannot be determined deterministically until after the fact. For planning purposes, a probabilistic approach is required.
At its core, reliability mirrors risk management. Risk managers view the world probabilistically because it is the only realistic way to predict future events. Drawing from risk‑management fundamentals and related standards, I present a model that helps you estimate the cost of a functional failure in a manufacturing process. The model is shown in Figure 1, and the following steps explain how to create and apply risk‑adjusted failure‑cost models.
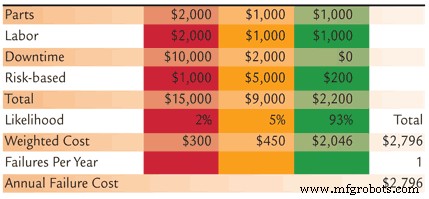
Figure 2. Estimated annual failure cost after deploying monitoring, planning, and reliability improvements.
1) Develop severity‑based cost estimates: Each functional failure carries costs—parts, labor, downtime, and risk‑based costs such as injury or environmental damage. Build a severity‑based cost model: high‑severity events might cost $15,000 per incident, moderate $4,500, and low $2,200. These figures represent weighted averages within each severity category, not exact amounts for every event.
Using three severity levels is common, but you can create more if needed. However, adding too many categories yields diminishing returns. Also, avoid discounting labor as sunk; it is a variable cost that decreases as processes become more automated and reliable.
2) Assign probability weighting factors: In the example, 10 % of failures are high severity, 20 % moderate, and 70 % low. Multiply each category’s cost by its probability and sum the products to obtain a weighted‑average cost per event. Here, high‑severity events contribute $1,500, moderate $900, and low $1,540, totaling $3,940 per event. This figure represents a probabilistic estimate, not a guaranteed cost.
3) Estimate annual event frequency: Cost‑benefit analysis requires annualized figures. Suppose the process experiences two failures per year. The estimated annual cost for this functional failure mode is $7,880. Any mitigation will alter either the severity distribution or the number of events per year (increasing MTBF/MTTF).
4) Shift the likelihood distribution: Planning tools often modify the probability distribution. Protective monitoring, inspections, and predictive analytics detect issues early, preventing escalation to higher severity. Effective scheduling and work management ensure timely response. While the base failure rate stays unchanged, the likelihood of high‑severity events decreases, and low‑severity events increase.
In the example, the high‑severity likelihood drops from 10 % to 2 %, moderate from 20 % to 5 %, and low rises from 70 % to 93 %. The weighted‑average cost per event falls from $3,940 to $2,796, as shown in Figure 2.
5) Reduce the failure rate: Proactive measures—condition monitoring, lubrication control, contamination prevention, balance and alignment, precision operation, and SOP‑guided maintenance—lower the failure rate itself. In the example, the failure frequency drops from two to one per year. Combining a lower failure rate with the improved severity distribution reduces the annual cost from $7,880 to $2,796.
Thus, improved detection and management alone yield a net benefit of $1,144 per year, while adding reliability initiatives raises the net gain to $5,084. If the required investments deliver a satisfactory return, the projects should proceed.
This column applies risk‑management models to quantify functional failure costs. In future issues, we’ll explore decision‑making under uncertainty for sparse data, then integrate these methods into comprehensive cost‑benefit analyses that boost approval rates for reliability improvement projects.
Equipment Maintenance and Repair
- FRACAS: Turning Equipment Failures into Business Gains
- Run‑to‑Failure Maintenance: When It Makes Sense & How to Plan It
- How to Reduce Maintenance Costs Without Sacrificing Reliability
- FRACAS: Unlocking Reliable Asset Performance
- From Predictive Maintenance to True Reliability: A Proven Roadmap
- Aligning Incentives to Build Machine Reliability
- Operator‑Driven Reliability: Empowering Operators to Own Plant Equipment
- Common Failure Modes in Equipment Reliability Programs
- Mastering Reliability: 7 Proven Steps to Safeguard Your Manufacturing Operations
- 4 Key Reasons Your CMMS Rollout May Fail (and How to Avoid Them)