


How Much Does Lubrication Really Cost? Understanding the True Impact
With crude oil prices climbing, both gasoline and lubricants are affected. Most lubricating oils—whether mineral or synthetic—originate from crude oil or natural gas by‑products, so their costs rise in tandem with fuel prices. In many manufacturing settings, lubricant spend represents less than 1‑2 % of the maintenance budget, but the real cost lies elsewhere.
The problem is not the price of a gallon of oil, but how that oil is applied. Mis‑lubrication leads to premature wear, higher repair costs, and lost production time. Yet many plants lack the data to quantify these hidden expenses because records are incomplete and work practices are unstandardized.
To bridge that gap, we employ an evidence‑based estimation framework that leverages the expertise of maintenance teams and the plant’s own financial history. The approach is straightforward:
- Estimate the current annual maintenance cost, then bracket it with historical low and high figures to create best‑case, likely‑case, and worst‑case scenarios.
- Calculate total annual downtime costs. This step often requires input from production and management, whose early involvement ensures realistic assumptions and ownership of the outcome.
- Identify the portion of maintenance and downtime that can be eliminated through a well‑designed lubrication program.
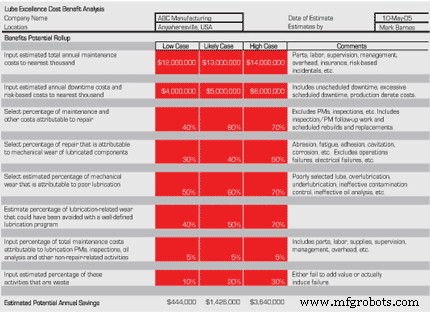
Figure 1. Assessing the cost of poor lubrication.
To estimate the opportunity costs of repairs caused by poor lubrication, we consider four key percentages (see Figure 1):
- Repair‑related costs (A) – Parts, labor, supervision, overhead, insurance, risk, and incidentals.
- Wear on lubricated components (B) – Replacement costs for shafts, housings, cages, fans, couplings, and other parts affected by lubrication failures.
- Wear due to poor lubrication (C) – Impact of incorrect lubricant selection, over‑ or under‑lubrication, improper schedules, inadequate contamination control, and weak oil analysis.
- Preventable wear (D) – Estimated percentage of wear that could have been avoided with best practices.
The opportunity cost for repairs is calculated as:
Opportunity costs (repair) = (maintenance cost + downtime cost) × A × B × C × D
We also assess inefficiencies in the lubrication program itself. The cost of poorly designed practices—such as suboptimal greasing intervals or excess material—can be estimated by:
Opportunity costs (inefficiency) = maintenance cost × X × Y
where X is the share of the maintenance budget spent on lubrication activities and Y is the fraction deemed unnecessary.
Using the example from Figure 1, a plant with a likely maintenance budget of $13 million and annual downtime costs of $5 million can identify $1,426,000 in repair and inefficiency costs that a best‑practice lubrication program could eliminate.
When many companies apply this analysis, the results are striking: losses from poor lubrication can consume 10‑20 % of the maintenance budget—10 times the cost of the lubricant itself.
Equipment Maintenance and Repair
- EV Public Charging Costs: What You Need to Know
- Azure DevOps Certification Cost Breakdown – What You Need to Know
- AWS DevOps Certification: Cost, Benefits, and Career Impact
- AZ‑104 Exam Cost & Preparation Guide – How Much Does the Azure Administrator Certification Cost?
- Understanding the True Cost of Robotic Automation for Manufacturers
- Industrial Robotic Arm Pricing Guide: What to Expect & How to Budget
- Understanding CNC Machining Costs: Key Factors & Pricing Guide
- How Much Does Replacing an Alternator Cost? – Prices, Factors, and Savings Tips
- What Is the Cost of a Metal CNC Machine? Pricing Insights & Investment Guide
- Estimated Costs for Repairing Hydraulic Pumps: What You Need to Know