


Elastic Behavior of Tantalum Single Crystals Under <100> Tensile Loading: Temperature, Pressure, and Phase‑Transition Insights from Molecular Dynamics
Abstract
Atomistic simulations can elucidate the mechanisms that govern the mechanical response of tantalum (Ta). In this study, we use molecular dynamics (MD) to examine how temperature and pressure influence the elastic properties of Ta single crystals subjected to <100> tensile loading. We first compare two embedded‑atom method (EAM) potentials – Zhou‑EAM and Ravelo‑EAM – for their ability to reproduce the elastic constants of Ta across a wide pressure range. The Ravelo‑EAM potential demonstrates superior performance, accurately capturing elastic moduli up to 140 GPa. MD simulations based on this potential reveal a body‑centered‑cubic (BCC) → face‑centered‑cubic (FCC) phase transition preceding fracture at 1 K, independent of model size or strain rate. Across 1–1500 K, the <100> elastic modulus E100 decreases linearly with temperature, while the yielding stress follows a quadratic temperature dependence. Pressure‑dependent simulations (0–140 GPa) show a monotonic increase in E100. These results provide a comprehensive, atomistic framework for predicting Ta’s elastic behavior under extreme conditions.
Background
Tantalum crystallizes in a body‑centered‑cubic (BCC) lattice at ambient conditions and is renowned for its exceptional phase stability, high melting point (3269 K), and resistance to oxidation. These properties make Ta an ideal candidate for diffusion barriers in microelectronics, wear‑resistant coatings, and high‑temperature super‑alloys. Extensive experimental and theoretical work—using diamond‑anvil cells, density‑functional theory (DFT), and MD—has explored Ta’s behavior under high pressure and temperature, consistently confirming the persistence of the BCC phase up to 135 GPa and revealing increasing elastic moduli with pressure. Despite these advances, a systematic atomistic investigation of Ta’s dynamic response to tensile loading remains lacking. This work addresses that gap by evaluating size, strain rate, temperature, and pressure effects on Ta’s elastic properties during <100> tension and by probing the possibility of a tensile‑induced phase transition.
Methods and Experimental Details
Physical Modeling
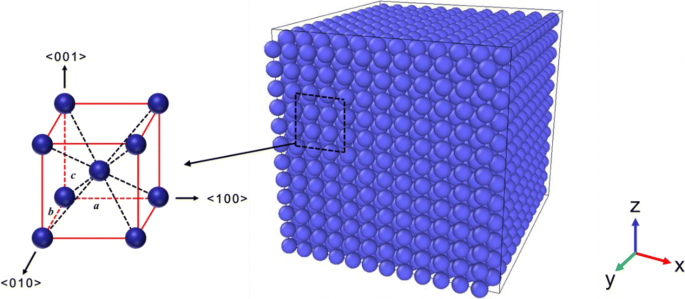
We construct cubic Ta cells by replicating the BCC unit cell along the <001>, <010>, and <100> directions, using lattice constants a = b = c = 3.301 Å. Four cell sizes (12 a = 3.96 nm, 18 a = 5.94 nm, 24 a = 7.92 nm, 30 a = 9.90 nm) contain 3 456 to 54 000 atoms. Figure 1 illustrates the 3.96 nm model, which is the primary structure used in all simulations.
MD Simulation Protocol
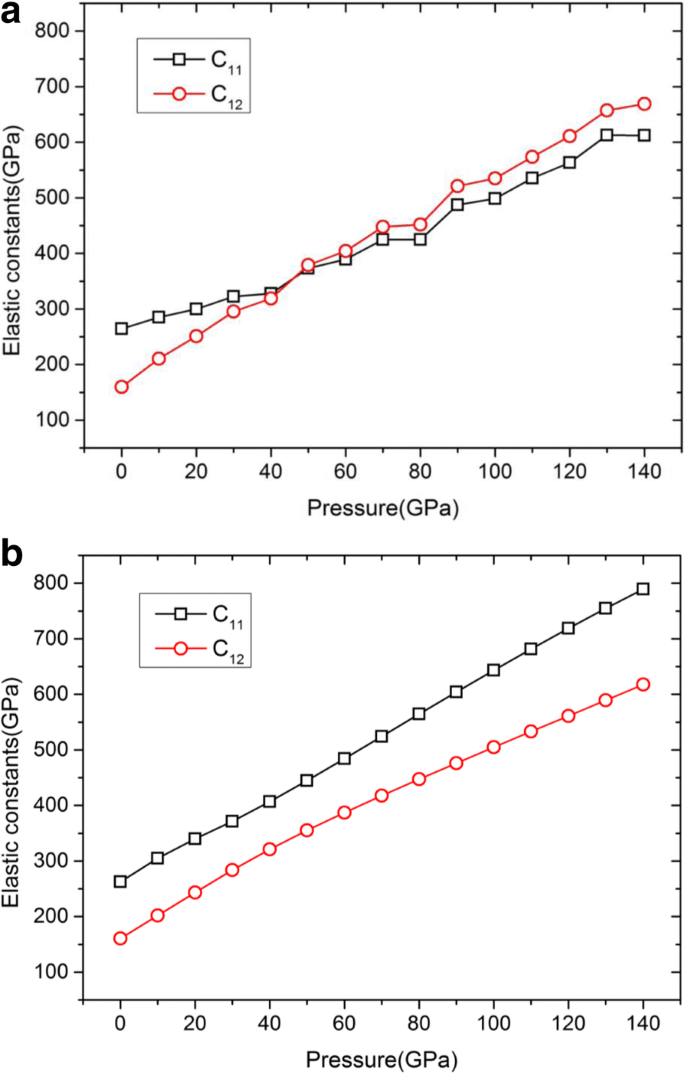
All simulations were carried out with LAMMPS. Two EAM potentials—Zhou‑EAM and Ravelo‑EAM—were evaluated for their ability to reproduce elastic constants at 0 K and under hydrostatic pressure. The Ravelo‑EAM potential, developed by Ravelo et al. (Phys. Rev. B 2013, 88, 134101), outperformed Zhou‑EAM across the pressure range of interest. We used the direct method to compute C11 and C12 and derived the <100> elastic modulus via Eq. (1). Subsequent simulations employed a 1 fs time step, periodic boundary conditions in all directions, and a 50 ps NVT relaxation followed by NPT equilibration to impose hydrostatic pressures (0–140 GPa). Tensile loading along x was applied at strain rates from 5 × 10⁸ s⁻¹ to 7.5 × 10⁹ s⁻¹ until a 15 % elongation was reached.
Results and Discussion
Stretching Process
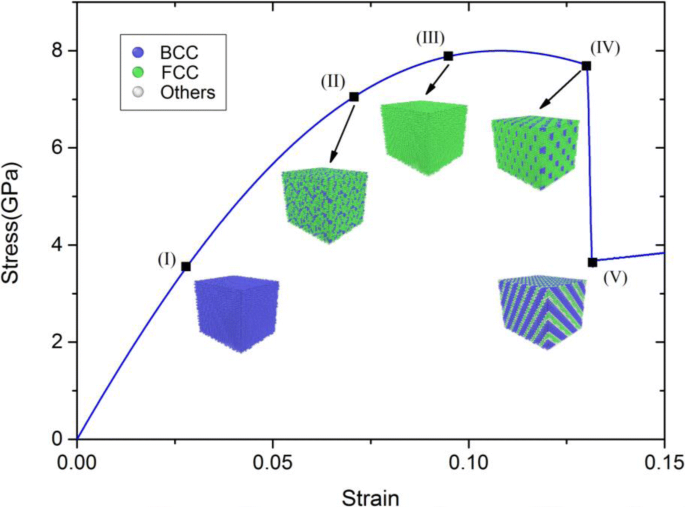
Figure 3 shows the stress–strain response and corresponding atomic configurations during <100> tension at zero pressure. Elastic deformation is linear up to ~7 % strain, after which a BCC→FCC transformation initiates at ~7.4 % and completes by ~9.8 %. The FCC phase persists until a surface fracture occurs near 13 %. The transformation and fracture mechanisms are consistent across all model sizes and strain rates, indicating negligible size or rate effects on the elastic modulus and yielding stress.
Size and Strain‑Rate Effects
Table 2 demonstrates that model size (3.96–9.90 nm) does not influence the elastic modulus (~139 GPa) or yielding stress. Similarly, Table 3 shows that strain rates between 5 × 10⁸ s⁻¹ and 7.5 × 10⁹ s⁻¹ produce no discernible changes in these properties. Consequently, a 3.96 nm cell and a strain rate of 5 × 10⁸ s⁻¹ were adopted for all subsequent analyses.
Temperature Dependence
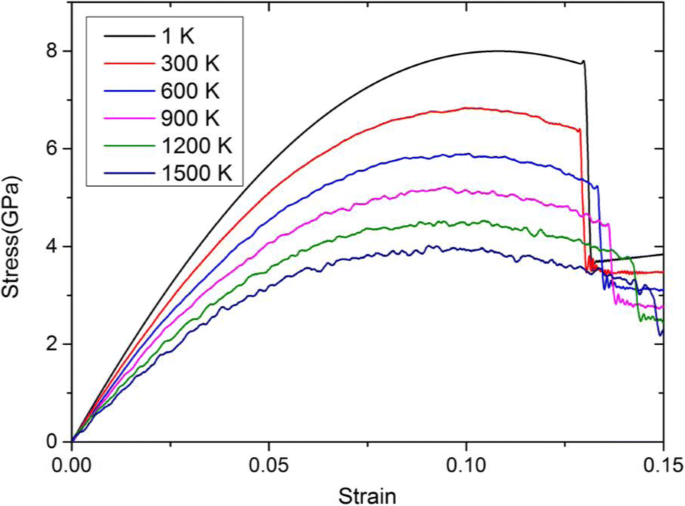
Figure 4 illustrates the evolution of the stress–strain curves from 1 K to 1500 K. Both the elastic modulus E100 and the yielding stress decrease monotonically with temperature. The modulus declines by ~42 % (136.5 → 76.7 GPa) and the yielding stress by ~51 % (≈8 → 4 GPa) over this range. A linear fit yields E100 = 138.07 – 0.04094 T (GPa), valid up to 1500 K, while a quadratic fit captures the yielding stress dependence.
Pressure Dependence
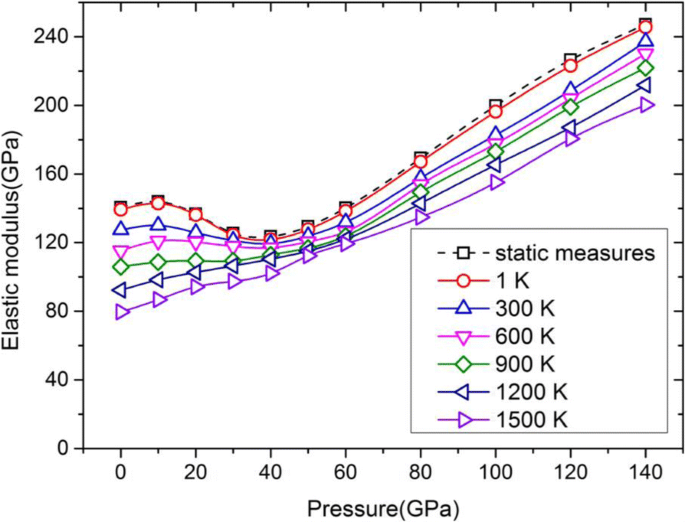
Figure 6 presents E100 versus hydrostatic pressure (0–140 GPa) at several temperatures. At 1 K, the dynamic results agree closely with static calculations based on Eq. (1). For temperatures ≤ 600 K, a concave region appears between 20–60 GPa, consistent with previous MD studies, whereas higher‑temperature curves remain monotonic. Across all temperatures, E100 increases with pressure above ~40 GPa, confirming that Ta’s stiffness is enhanced under compression.
Conclusions
We performed a comprehensive MD investigation of Ta single crystals under <100> tension across a broad spectrum of temperatures (1–1500 K) and pressures (0–140 GPa). The Ravelo‑EAM potential proved reliable for high‑pressure simulations. Key findings include: (1) a BCC→FCC phase transition precedes fracture at low temperature; (2) elastic modulus and yielding stress decline linearly and quadratically, respectively, with temperature; (3) pressure enhances the elastic modulus above ~40 GPa; and (4) model size and strain rate exert negligible influence on the measured elastic properties.
Nanomaterials
- Surface Properties Govern Oil Transport in Nanochannels: Molecular Dynamics Insights
- Molecular Dynamics Investigation of Ultra‑Precision Diamond Cutting of Cerium
- Structural, Electronic, and Magnetic Characterization of Ag<sub>n</sub>V (n = 1–12) Clusters via DFT and CALYPSO Search
- Comparative Analysis of Electrochemical, Biomedical, and Thermal Properties of Natural vs. Synthetic Nanomaterials
- How Nanoparticle Size and Agglomeration Influence Interfacial Strength and Tensile Performance in Polymer Nanocomposites
- How Temperature Influences the Young’s Modulus of Electrospun Polyurethane Nanofibers
- Thermal Conductivity of Novel 2D Carbon Allotropes with 558 Rings: Insights from Molecular Dynamics
- Shape Stability of Metallic Nanoplates: Insights from Molecular Dynamics Simulations
- Tailoring Electronic and Optical Properties of WSSe Bilayer via Strain Engineering
- Exploring Tip-Based Nanomachining with Molecular Dynamics: A Comprehensive Review