


Calculating the Hidden Costs of Application and Network Performance Issues
Many prospects and customers are surprised to discover how comprehensive infrastructure monitoring can be. Today’s environment—cloud providers, SaaS apps, remote offices, and tech‑savvy distributed teams—creates a complex tapestry that can feel overwhelming. It’s no wonder that monitoring the whole stack can seem impossible; IT teams are still learning how to manage the growing array of tools and users.
When performance problems surface, they’re usually caught only after users submit tickets for slow applications, Wi‑Fi glitches, or recurring task failures. IT then dives into troubleshooting, often with mixed results. Root‑cause discovery becomes a reactive exercise, chasing elusive “ghost” issues long after the user has been impacted—an approach that’s like closing the barn door after the horse has already escaped.
For both IT and the business, these user frustrations are more than annoyance. Network and application slowdowns translate into real financial loss. Consider a 300‑person organization that relies on G Suite or Office 365. With an average hourly wage of $25 per user, each hour that employees can’t access an application costs the company roughly $7,500. A recent survey found that 98 % of organizations believe a single hour of downtime costs more than $100 000, and 33 % report that one hour of downtime costs between $1 million and $5 million.
What Performance Problems Cost Your Business
Historically, downtime was the main concern. Today, however, applications are engineered for high availability; the real threat is sluggish performance. Users complain more about an app hanging on a task or taking too long to load than about outright outages. Many performance hiccups are intermittent and hard to reproduce, often surfacing as vague “Wi‑Fi problems.”
Research focused on Office 365 deployments shows that 70 % of businesses report weekly latency issues, and 69 % still experience bandwidth problems even after network upgrades. The promise of SaaS does not automatically remove performance pressure.
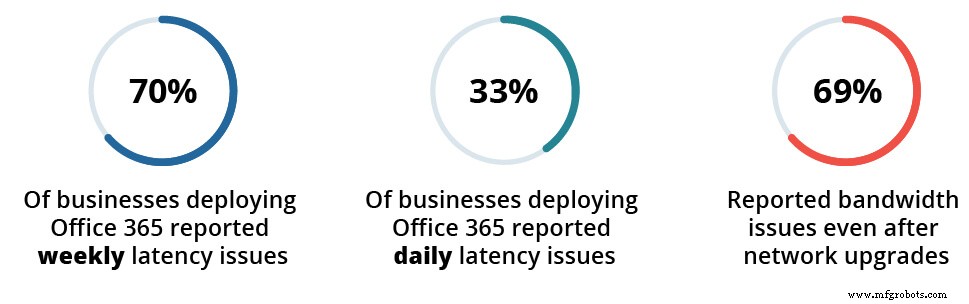 Source: Talkin' Cloud
What does a 10 % slowdown in a critical application cost? If every employee takes 10 % longer to complete tasks, that translates to a 10 % performance drop. With an 8‑hour workday and a $25 hourly wage, each employee’s daily cost is $200. A 10 % degradation results in a $20 loss per employee per day—equivalent to 48 minutes of lost productivity. Across 300 employees, that’s a $6,000 daily hit.
Over a year, if 10 % of the 250 working days experience such slowdowns (about 25 days), the organization faces a $150,000 productivity loss. Even a conservative estimate of 5 affected days still incurs a $30,000 loss.
The Costs of Managing IT in the Dark
These figures are illustrative, but the reality is that most companies lack continuous visibility into their application and network performance. Performance discussions typically erupt only during a firefight or outage, leaving root‑cause analysis as an afterthought—if it happens at all—so problems recur.
Modern IT infrastructures contain many more components than ever, and issues can arise in multiple layers. For example, do you know whether your SaaS providers or ISPs met their contracted SLA commitments last year? Working with cloud and SaaS partners now often involves a new kind of finger‑pointing: “Is it the ISP or the cloud provider?”
Because most modern applications depend heavily on the network, measuring performance demands visibility across both the application layer and the underlying network. That’s where AppNeta comes in. Our performance‑monitoring solution pinpoints the root cause of problems in SaaS and web applications, as well as in public and cloud provider networks.
Cloud Computing
- Why Molybdenum Dominates Glass Manufacturing
- Niobium’s Critical Role in Modern Steel Production
- SD‑WAN: From Promises to Reality—What IT Teams Should Know
- Understanding the Hidden Costs of Salesforce Integrations
- Mastering Cloud Application Monitoring: Insights for IT Leaders
- 10 Key Factors for Selecting the Perfect Switch for Your Application
- Choosing the Optimal Drive System: Cost and Performance Insights
- Glass Fiber Performance: Physical, Mechanical & Chemical Properties Explained
- Securing the IoT from Hardware to Application: A Layer‑by‑Layer Blueprint
- Understanding CNC Machining Costs: Key Factors and How to Optimize