


How to Debug Zephyr‑Based IoT Devices: Proven Remote‑Monitoring Practices
The Linux Foundation’s Zephyr Open Source Project has become the cornerstone for countless IoT solutions. With a lightweight, scalable, real‑time operating system (RTOS) engineered for resource‑constrained devices, Zephyr supports a broad spectrum of architectures—ARC, Arm, Intel, Nios, RISC‑V, SPARC, Tensilica—and more than 250 boards. Today, the project boasts 1,000 contributors and 50,000 commits, continuously expanding its multi‑architecture reach.
Developing for Zephyr demands attention to reliability. Issues that surface in the lab often disappear only when devices scale, or when network stacks evolve. A robust strategy for remote monitoring and debugging is essential to detect, diagnose, and resolve problems before they translate into costly downtime.
Consider our work with GPS trackers for farm‑animal monitoring. Each collar had to operate seamlessly across multiple cellular networks, countries, and roaming zones. Unexpected power drain due to misconfiguration would have translated into significant economic loss. We needed not just to flag the issue, but to understand its root cause and deploy a fix—hence the need for real‑time, remote observability.
We combined Zephyr with Memfault, a cloud‑based device observability platform, to build a monitoring stack that covers firmware updates, reboots, watchdogs, faults, asserts, and connectivity metrics.
Setting Up an Observability Platform
Memfault empowers developers to monitor, debug, and roll out firmware changes remotely, enabling:
- Graceful production rollouts that avoid freezes
- Continuous health monitoring of device fleets
- Zero‑downtime patches delivered before users notice a hiccup
Integrating the Memfault SDK into Zephyr is straightforward: add the module to your west.yml manifest and enable it in prj.conf.
# west.yml
[ ... ]
    - name: memfault-firmware-sdk
      url: https://github.com/memfault/memfault-firmware-sdk
      path: modules/memfault-firmware-sdk
      revision: master

# prj.conf
CONFIG_MEMFAULT=y
CONFIG_MEMFAULT_HTTP_ENABLE=y
1️⃣ Focus on Reboots
Increased reset rates are often the first sign of a deeper issue—hardware degradation, firmware bugs, or network anomalies. By distinguishing between hardware and software resets, you can pinpoint whether a fault is widespread or isolated to a subset of devices.
Record the reason before a reboot
void fw_update_finish(void) {
    // …
    memfault_reboot_tracking_mark_reset_imminent(kMfltRebootReason_FirmwareUpdate, ...);
    sys_reboot(0);
}
Zephyr preserves a user‑defined region across resets; Memfault hooks into this to capture the reboot context. After a reboot, register an init handler to read the hardware reset reason and send it to the cloud.
static int record_reboot_reason(void) {
    // 1. Read hardware reset reason register (refer to MCU datasheet)
    // 2. Capture software reset reason from noinit RAM
    // 3. Send data to server for aggregation
}
SYS_INIT(record_reboot_reason, APPLICATION, CONFIG_KERNEL_INIT_PRIORITY_DEFAULT);
Example: a power‑supply defect can manifest as thousands of reboots in a short period. Figure 1 shows a fleet where 99 % of 12,000 reboots per day are attributed to just ten devices—likely a mechanical or battery issue. Firmware updates can mitigate such problems, but remote monitoring lets you detect and address them before they cascade.
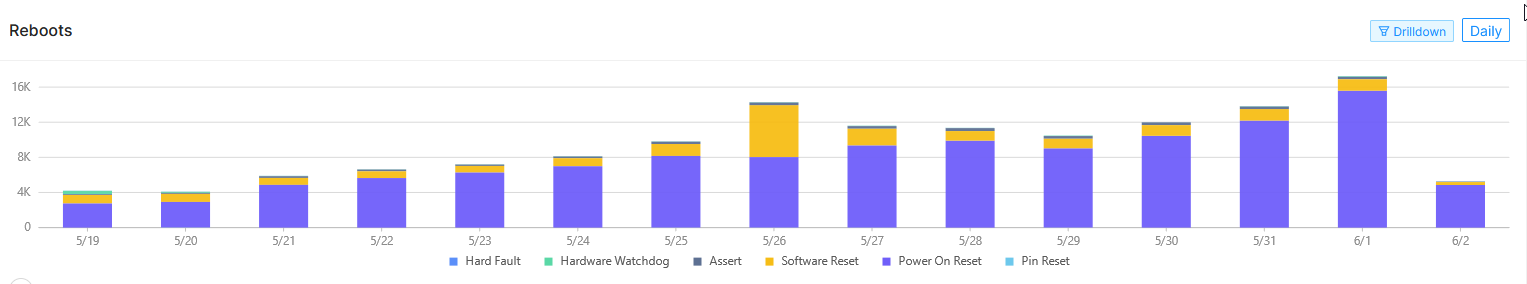
Figure 1: Power Supply Issue, Reboots Over 15 Days. (Source: Authors)
- 12K device reboots a day – too many
- 99% of reboots from 10 devices
- Mechanical defect causing constant resets
2️⃣ Leverage Watchdogs
Watchdogs are your last line of defense against hangs—whether caused by blocked network stacks, infinite loops, deadlocks, or memory corruption. Zephyr exposes a unified watchdog API that abstracts hardware differences.
void start_watchdog(void) {
    struct device *s_wdt = device_get_binding(DT_LABEL(DT_INST(0, nordic_nrf_watchdog)));
    struct wdt_timeout_cfg wdt_config = {
        .flags = WDT_FLAG_RESET_SOC,
        .window.min = 0U,
        .window.max = WDT_MAX_WINDOW,
    };
    s_wdt_channel_id = wdt_install_timeout(s_wdt, &wdt_config);
    const uint8_t options = WDT_OPT_PAUSE_HALTED_BY_DBG;
    wdt_setup(s_wdt, options);
}

void feed_watchdog(void) {
    wdt_feed(s_wdt, s_wdt_channel_id);
}
For the Nordic nRF9160, the typical workflow is:
- Configure the device tree for the watchdog.
- Set parameters via the API.
- Install the watchdog.
- Periodically feed it; a missed feed triggers a reboot and a Zephyr fault handler.
Memfault captures the pre‑reset state, allowing you to trace back to the offending code path. Example: an SPI driver that becomes stuck after 16 months of deployment is revealed by a watchdog‑initiated fault. Figure 2 illustrates the timeline and degradation, while Figure 3 shows the fault‑handler register dump.
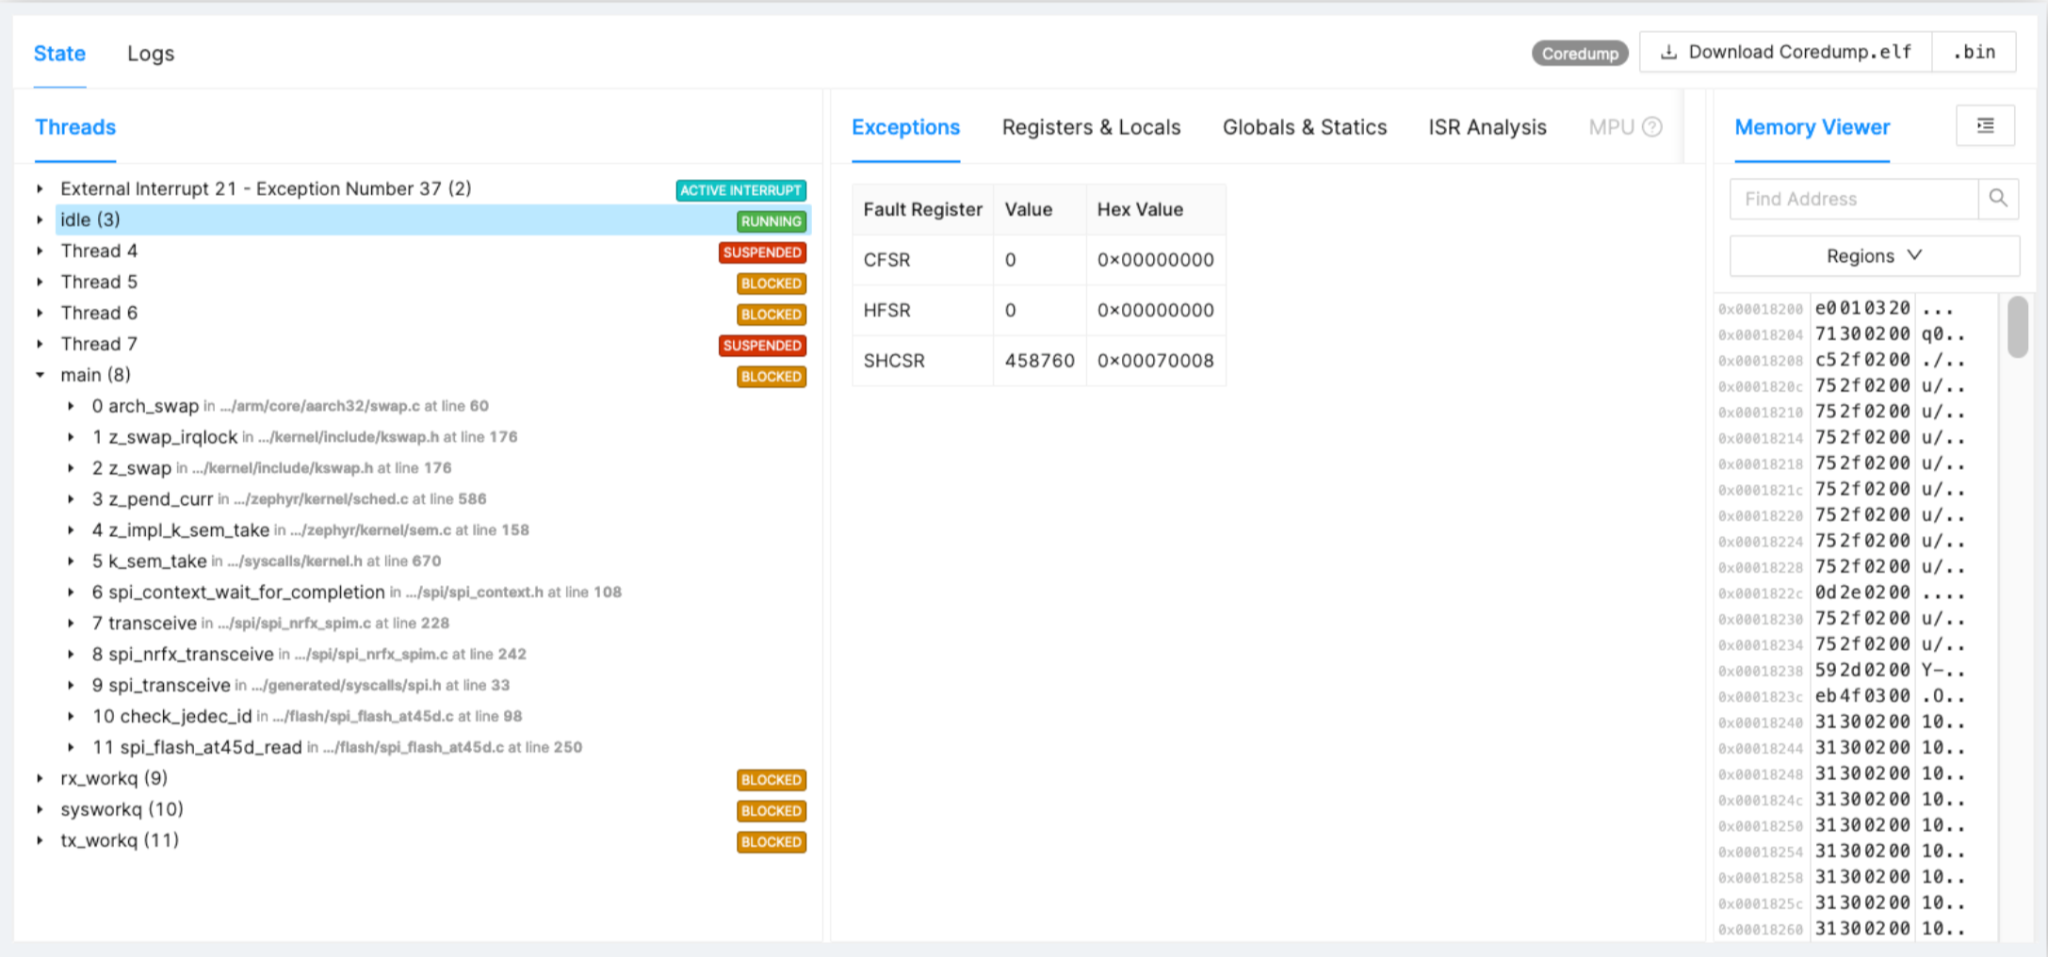
Figure 2: SPI Driver Stuck Example. (Source: Authors)
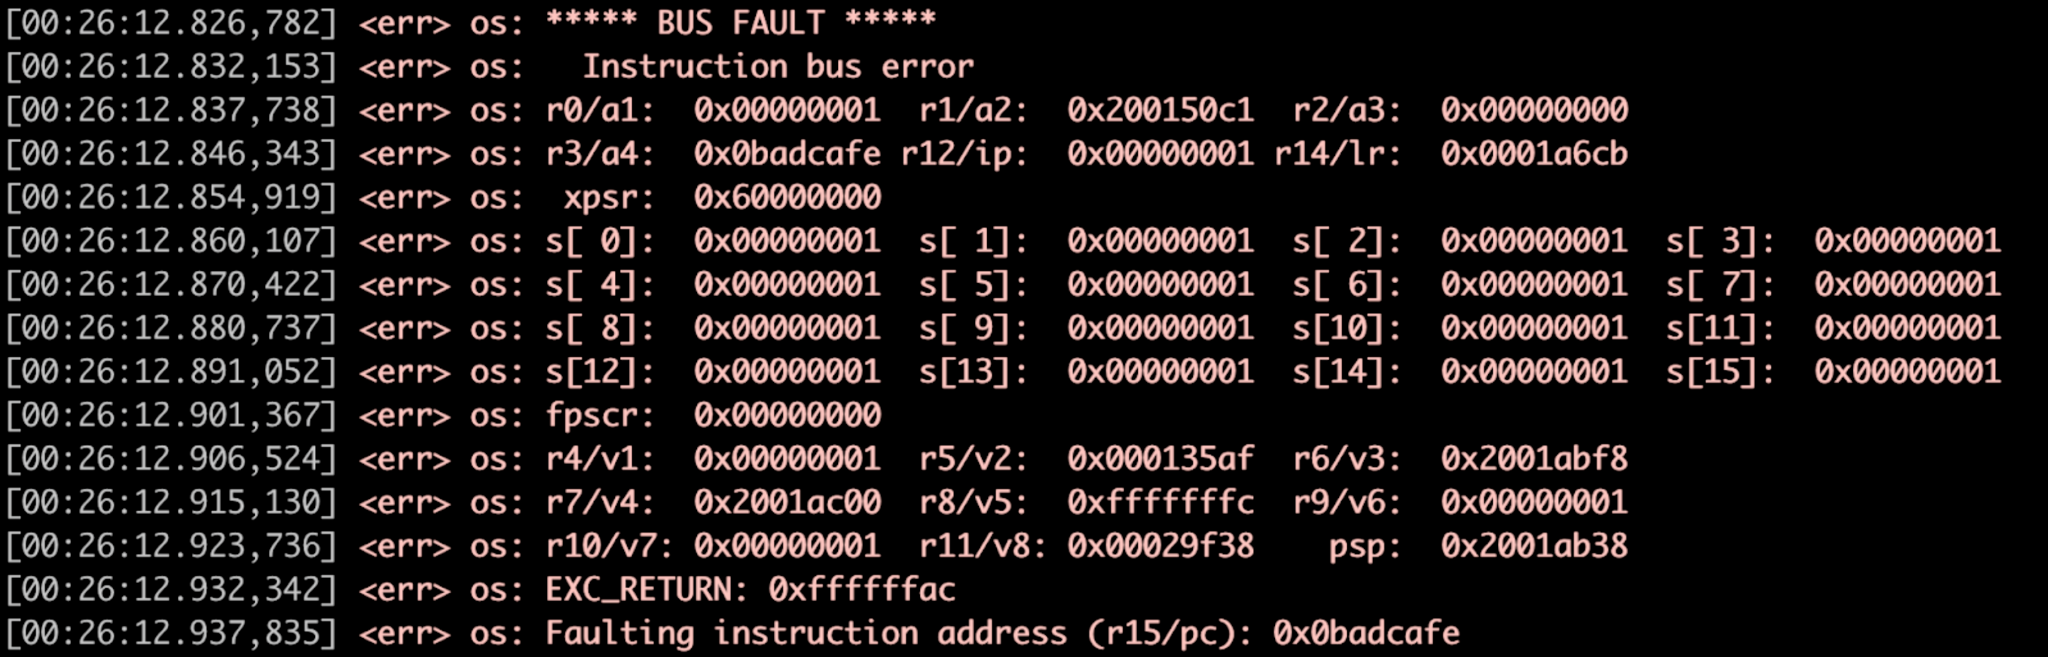
Figure 3: Fault Handler Example, Register Dump. (Source: Authors)
3️⃣ Handle Faults and Asserts
When an assert or fault triggers, Zephyr’s fault handler captures the CPU state. Memfault seamlessly hooks into this flow, persisting registers, kernel context, and a snapshot of all active tasks to the cloud.
void network_send(void) {
    const size_t packet_size = 1500;
    void *buffer = z_malloc(packet_size);
    // Missing NULL check leads to fault
    memcpy(buffer, 0x0, packet_size);
}

bool memfault_coredump_save(const sMemfaultCoredumpSaveInfo *save_info) {
    // Store register state, kernel & task contexts, selected .bss/.data
}

void sys_arch_reboot(int type) {
    // …
}
Key diagnostics include:
- The Cortex‑M fault status register indicates the cause.
- Memfault restores the exact code line and surrounding task states.
- The
_kernelstructure reveals scheduler status and, for connected stacks, Bluetooth or LTE parameters.
4️⃣ Track Device‑Level Metrics
Metrics give you a quantifiable view of fleet health. Commonly monitored values include CPU load, connectivity metrics, and thermal data. Memfault’s SDK lets you declare and report metrics with minimal code.
- Define a metric
MEMFAULT_METRICS_KEY_DEFINE(
    LteDisconnect,
kMemfaultMetricType_Unsigned)- Update in code
void lte_disconnect(void) {
    memfault_metrics_heartbeat_add(
        MEMFAULT_METRICS_KEY(LteDisconnect), 1);
    // …
}
Memfault’s cloud backend aggregates metrics by device and firmware version, providing a web UI to compare fleets and trigger alerts. Typical use cases:
- NB‑IoT/LTE‑M connectivity: monitor modem power states to gauge battery impact.
- Cell‑tower events and PSM timing: identify signal‑quality hotspots that drain power.
- Large‑fleet telemetry: spot outliers and unexpected data spikes.
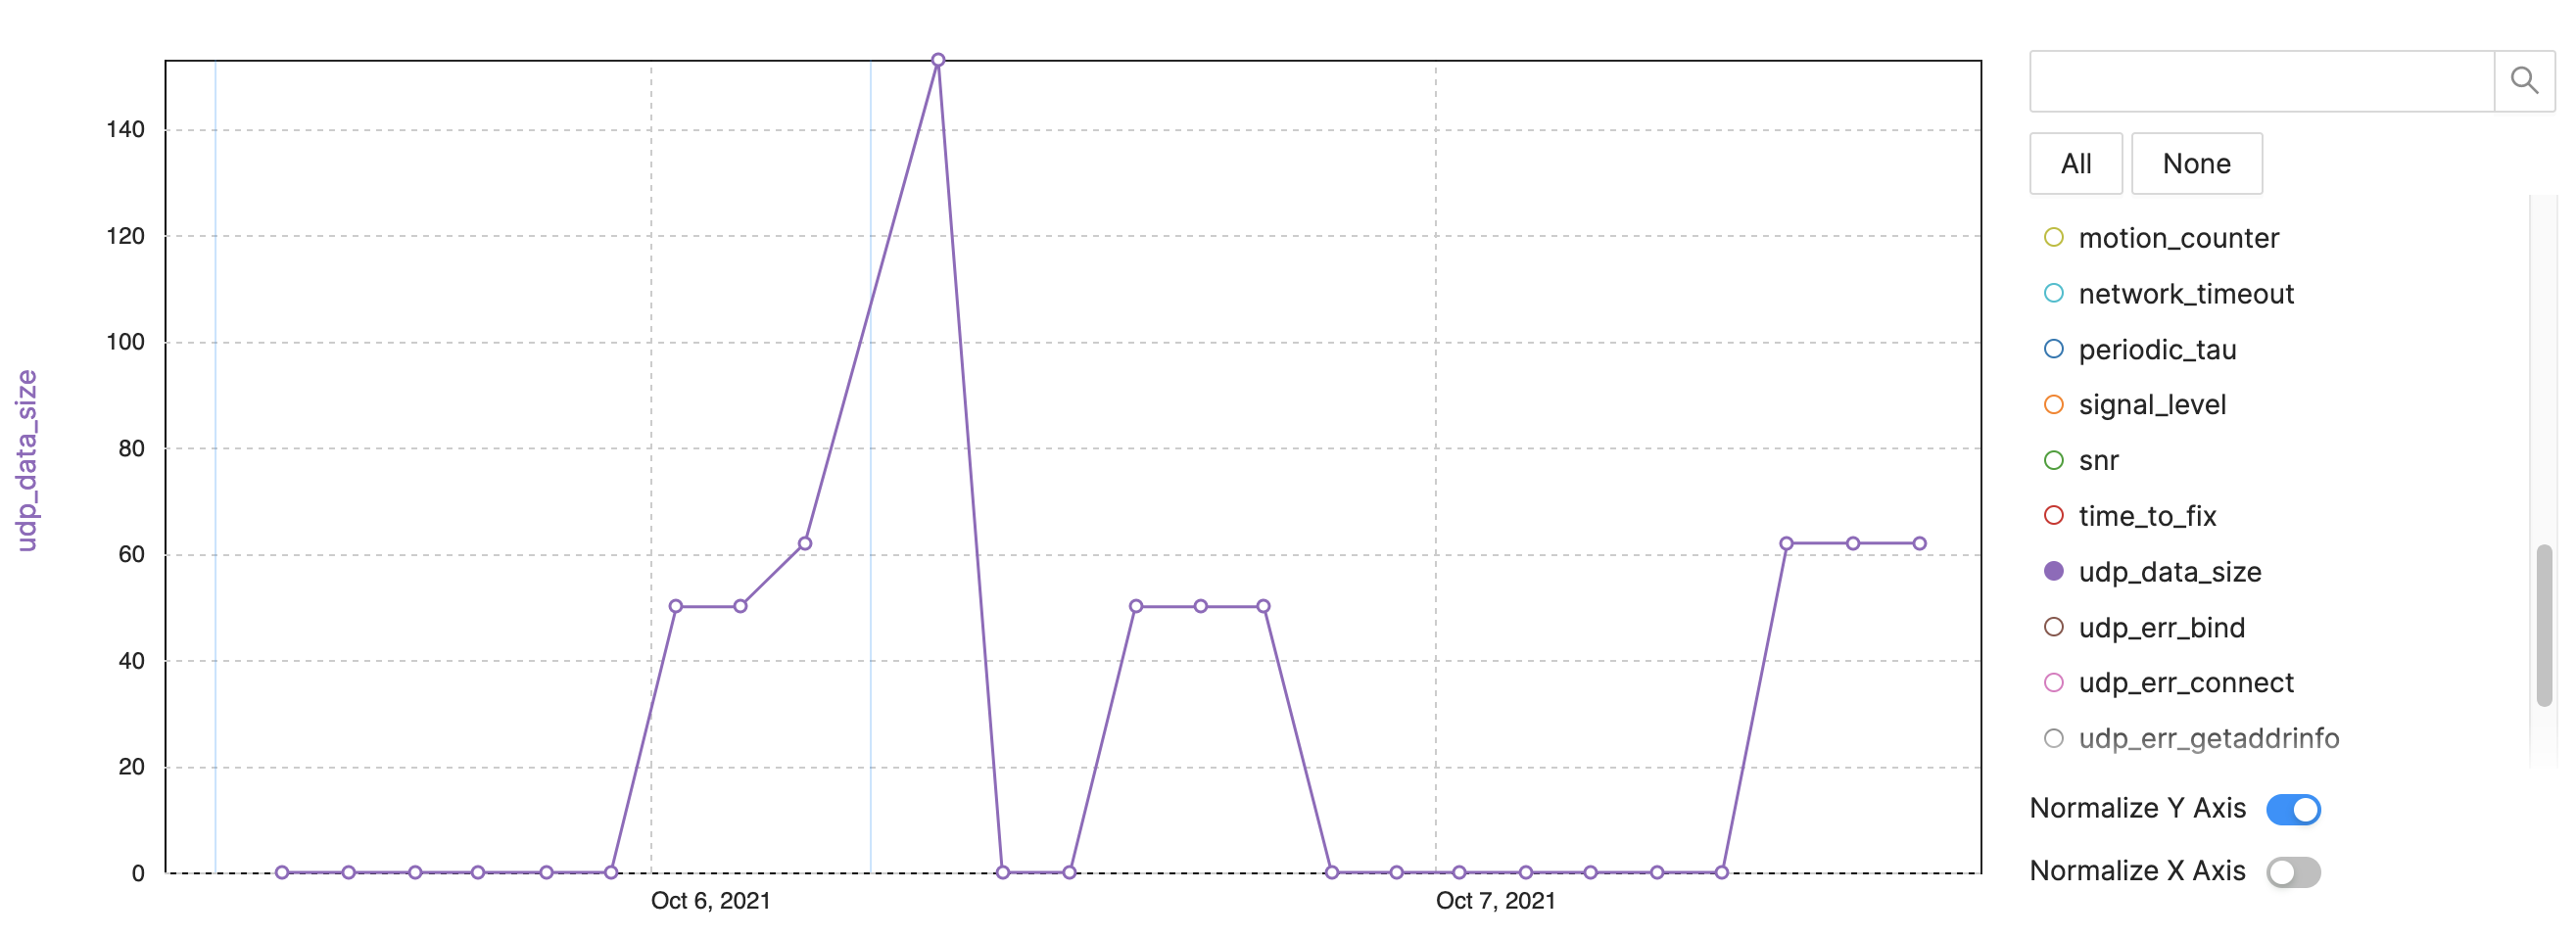
Figure 4: Tracking Metrics for Device Observability – NB‑IoT Example, LTE‑M Data Size. (Source: Authors)
- UDP data size per send interval.
- Data surge after reboot.
- Large packets indicate embedded traces or diagnostics.
- Use metrics to control data usage and cost.
Conclusion
By integrating Zephyr with Memfault, developers gain a powerful, end‑to‑end observability stack. Focus on four pillars—reboots, watchdogs, faults/asserts, and connectivity metrics—and you’ll turn a fleet of devices from opaque black boxes into transparent, manageable systems. For deeper insights, watch the recorded presentation from the 2021 Zephyr Developer Summit.
Internet of Things Technology
- Mastering Synthetic Monitoring: Proven Best Practices for Reliable SaaS & Web Performance
- Essential Security Practices for Fog Computing
- Bluetooth LE vs. ZigBee: Choosing the Right Low‑Power Protocol for IoT
- Kontron KBox A‑150‑WKL: High‑Performance, Low‑Power IoT Edge PC for Industrial Automation
- How Face‑Time Coaching Transforms Maintenance Supervision
- 12 Proven Practices for a Successful CMMS Implementation
- Secure Your IoT Infrastructure: 3 Proven Best Practices
- Mastering Aluminum Welding: Proven Techniques for Strong, Reliable Joints
- Robotic Welding Best Practices: Boost Quality, Speed, and Savings
- Why IoT Is Essential for Asset Management: Top 3 Benefits