


Portable IoT Weather Station with Arduino Nano 33 IoT
Components and supplies
 |
| × | 1 | |||
| × | 1 | ||||
| × | 1 | ||||
| × | 1 | ||||
| × | 1 | ||||
| × | 1 | ||||
| × | 1 |
Necessary tools and machines
 |
|
Apps and online services
 |
| |||
 |
|
About this project
There are a lot a apps out there that allow you to connect your smartphone to the Internet of Things. I have tried a bunch of them and have usually been disappointed. Not so with Blynk! It is really flexible, has a beautiful user interface, works with all kinds of IoT platforms, and runs on both Android and iPhone. It is also free for hobbyists! So this is a relatively simple IoT project that allowed me to explore using Blynk.
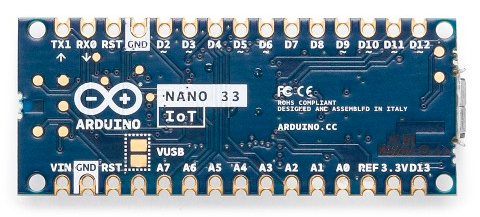
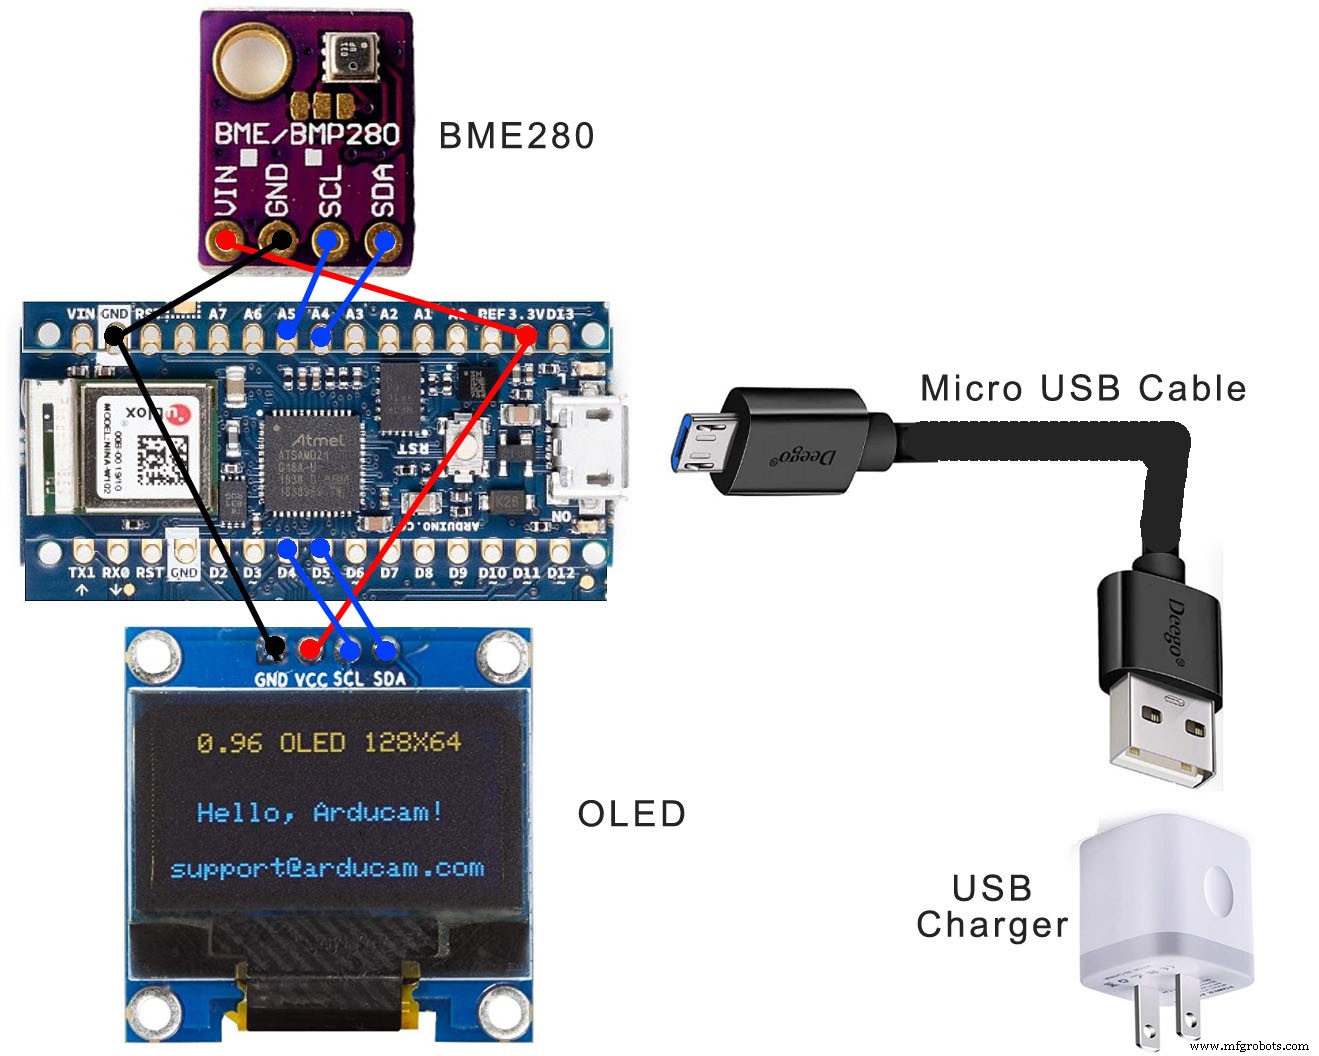
HardwareThe hardware for this project is fairly simple. We use the Arduino Nano 33 IoT which handles WiFi, a BME280 sensor board with temperature, humidity and barometric pressure all in one unit, and a 1 inch OLED display. All three run fine at 3.3 volts. The display is obviously optional - the goal is to get the weather station displaying on your phone. But it makes it much easier to get everything up and running on the OLED display first, before dealing with Blynk and your smartphone.
The schematic below shows how the hardware is interconnected. Both the sensor and the display interface with I2C. In theory, one I2C can support multiple devices, but the libraries of the sensor and display had some conflicts, so I ended up with two different I2C ports. The sensor uses the normal default I2C port at analog pins 4 and 5. The display uses a secondary I2C port set up at digital pins 4 and 5. (And yes, they are reversed - SDA is digital pin 5))

The hardware is enclosed in a small plastic case with a clear front, so that the display can be viewed. It is plastic, as it needs to be transparent to RF for WiFi. It needs to be relatively weather-proof, but the sensor is exposed to the outside weather by a 1/2" hole at the bottom. The sensor is attached so that it sits just inside that hole. I attached everything inside the case with hot glue, but you might want to use epoxy instead if you are planning to put it outside in the summer heat.
Power is supplied through the USB cable. That way, it can be programmed or powered by a single cable coming out of the box. That cable can go to your computer when programming or to a plug-in USB power supply when in use as a weather station.
SoftwareThe software running on the Arduino is just a little more than a mash-up of the library examples for the sensor, the display and Blynk. The libraries involved are the Adafruit_BME280_Library for the sensor, the ss_oled library for the display, and the Blynk library for Blynk. All three can be downloaded directly from Arduino's library manager. You may want to experiment with each of these libraries separately to get a better understanding of each.
Blynk has a bunch of examples of how to configure hardware to interface with it: https://examples.blynk.cc/ Unfortunately, it doesn't list the Nano 33 IoT as one of its supported Arduino's. But Blynk does support WiFiNINA, which is used by the Nano 33 IoT and several other Arduino processors. So adding these two includes solved that problem: #include<WiFiNINA.h> and #include<BlynkSimpleWiFiNINA.h
One other addition you will see in my code is: #include <avr/dtostrf.h> This was necessary to convert the numbers coming out of the sensor into strings suitable to display on the OLED display. One little twist on this that gave me some grief was that Blynk is happy to display the data whether sent as a string or a number. At first I sent Blynk the same string I was sending to the OLED. That worked fine to display the numbers, but failed totally when I added graphs. To get the graphs to work, Blynk obviously needed actual numbers.
Note - barometric pressure is normally reported corrected to sea level. At higher elevations, barometric pressure obviously drops, so to correct values from the sensor to their equivalent reading at sea level, you must add in a value to the measured value of roughly 1 inch Hg for every 1000 feet of elevation. In my own code attached, you will see I added 1.3 to compensate for my own elevation of 1300 ft. above sea level. You will want to change this value to match your own elevation. The 1" Hg per 1000 feet is just a rough estimate. If you want a precise correction, there are tables online that will give you the exact correction for your elevation.
Weather Station without BlynkAt this point, you can set up the hardware, and use my attahed software to display weather data on the OLED display. Just comment out the Blynk.begin() line in Setup to get the weather station to run by itself. (If you don't comment out Blink.begin(), without a valid connection to Blynk, the sketch will stop at or hang at that point.) In the next section, we will talk about Blynk, how to set it up both on the Arduino sketch and on the smartphone to display the weather station on the phone.
BlynkBlynk is easy to install on your iPhone or Android and comes with detailed documentation: http://docs.blynk.cc/ But there is so much information there and so many options that I found things a little confusing at first, so I will provide here my own version of how to get started with Blynk.
I used Blynk with an iPhone, but I think the experience is similar enough with Android that you can follow my instructions with either one. Once you have the app, you need to create an account. From there, within the app, you create a new project. Your project is provided with an authentication code that is used to link your hardware with your project. Your first job is to get your hardware connected through WiFi to your Blynk project. You can accomplish this and test it out using Blynk's default sketch/program called Blynk Blink at examples.blynk.cc, which allows you to turn on and off the onboard LED on your Nano 33 IoT. My suggestion is you try this and get it working before trying to get the weather station working with Blynk.
We have already talked a little about configuring our software to get our Nano 33 IoT to work with Blynk. If you open examples.blynk.cc, it defaults to a ESP8266 board. Find #include <ESP8266WiFi.h> and #include <BlynkSimpleEsp8266.h> and replace them with #include<WiFiNINA.h> and #include<BlynkSimpleWiFiNINA.h for our Nano 33 IoT board.
In addition to adding WiFiNINA support for the Nano 33 IoT, as we already talked about, you need to add your WiFi credentials and your Blynk project's authentication code. We will explain turning on and off the LED in a minute, but first, let's just check the connection. With the Blynk Blink sketch properly configured and running, open Arduino's Serial Monitor, and you should be able to watch the connection being made to the Blynk cloud server. At this point, we can set aside our hardware and work with the Blynk app on the phone.
I'll admit I found the Blynk app somewhat confusing. The icon at top left allows you to select between projects and also log out of your account. The one at top right allows you to go in and out of Edit Project mode. What the one in the middle does depends on where you're at.

To get control of our onboard LED, we need to enter Edit mode in the app. You will then see a blank screen. If you swipe left, it will move aside to reveal a toolbox of widgets. Select a button by clicking on it and it will now be on the main screen. Click on it there and it will open for configuration. Move it from push mode to switch mode. Use pin select to select the onboard LED - digital pin 13 on our Nano 33 IoT. Now click OK, and hit the top right icon to exit Edit mode. Your button should now control the LED.
Weather Station with BlynkWe are now ready to link our weather station to our Blynk project. Open my attached software, uncomment the Blynk.begin() line in Setup, add your project authentication code and WiFi credentials, and upload to Arduino.

Open Blynk on your phone. If you have followed this tutorial, your button is still there, and should still be able to turn the onboard LED on and off. Go to edit mode, click the button to configure it, and delete it with Delete at the very bottom. Now go to the toolbox and select a Labeled Value. It's down the list a way under Displays. Back on display page, click on the Labeled Value display to configure it. Click on pin, then select Virtual pin V3. We will explain virtual pins in the next paragraph. Now for the label, where it says "e.g. Temp" type "Temp /pin.#/ deg.F". The.# tells the app to display one place past the decimal point. Select the large text size, and leave Refresh Interval on Push and Text Color on Green. Now click OK. Your Labeled Value is now almost ready to display the temperature, but it is too narrow. Select it slowly - slow enough that it does not reenter configuration mode. The outline of the label will light up. It can now be stretched to display the whole line. It can also be moved around, though we won't do that here. Stretch it about 3/4 of the way across the the screen. Then exit Edit mode and you should see the temperature displayed on your phone.
Before we finish configuring Blynk, it is worth explaining a couple of things we just saw in setting up the temperature display. Blynk uses a somewhat unique idea called virtual pins. The display value widget could be set to read an analog pin on our processor, or set to read whether a digital pin is high or low. But more often than not, we want to display the content of a variable. We do that by assigning that variable a virtual pin number, and from then on, the Blynk app will reference that variable by it's virtual pin number. So in my software, you will see a spot where I assigned temperature in Fahrenheit to virtual pin V3.
Another Blynk idea worth quickly mentioning is the Refresh Interval that we left in Push mode. That means the Arduino sketch is pushing the data out, in our case updating temperature, humidity and barometric pressure once per minute. But Blynk also supports a Pull method, where the Blynk app sets the interval and interrogates the hardware for new data.
So now let's finish up displaying our weather station on Blynk. You will need two more Labeled Value displays, one for Humidity in % (Virtual pin V4) and one for Pressure in " in. HG" or inches of mercury (Virtual pin V5). To make it look like mine, you will want humidity in gold and pressure in red. For humidity, I showed one place past the decimal point; for pressure, I showed two places past the decimal point.
If you now have the three Labeled Value displays showing temperature, humidity and barometric pressure, you can add the graph of all three. This is accomplished with the addition of a SuperChart widget. First, stretch it downward so that it fills the rest of the screen. Then click on it to configure. I turned on Show x axis values and I chose resolutions of live, 1 hr, 6 hr, 1 day, 1 wk, 1 mo. and 3 mo. We need three data steams - one for each of our 3 variables. To configure each data stream, click the icon to the right of it. We need to again select the virtual pin for each. For y axis scaling, choose height. Then for temperature, set height to 67 - 100. For humidity, set height to 34 - 66. For pressure, set height to 0 - 33. Set the colors to match the labeled values. Turn on Show Y axis. That's about it. Get out of Edit mode and your phone display should look like mine. It takes a little time for the graph to get started. For fast results, view live or 1 hour resolution.
One more feature of Blynk you might want to know about is sharing your finished Blynk project with other smartphones, so that more than one phone can view the weather station. To initiate sharing, put your project in Edit mode, and click on the top middle icon for Project Settings. Turn on Sharing, and then generate a link. It will give you a QR code which you can email or otherwise share. The new user needs the Blynk app but not an account on Blynk. The app of an unregistered user has a link to load the QR code of another person's Blynk project. That's it.
This has been a pretty limited introduction to Blynk, but should give you a good place to start. I mentioned earlier that Blynk is free - well it almost is. Both widgets and sharing use up points which Blynk calls energy. I think you get 2500 points for free to start with. That is more than enough to do this project for free. But sharing it or adding to it may cause you to run out of Blynk energy. I spent $6 to get an additional 5000 points. You may need to spend a few dollars for Blynk fuel if you get into doing other projects with Blynk.
Code
- Tiny Internet Weather Station
Tiny Internet Weather StationArduino
With WiFi and Blynk to Smartphone/*
This sketch is for the Arduino Nano 33 IoT
It uses a BME280 sensor board
It uses a 0.96 inch 128 x 64 OLED display
It connects through WiFi to the Blynk cloud server for display of weather data on a smartphone
*/
#include <Wire.h>
#include <SPI.h>
#include <Adafruit_BME280.h> // BME280 library
#include <avr/dtostrf.h> // used to convert weather numbers to strings for display on OLED
#include <ss_oled.h> // OLED library
// Next two includes required to make Nano 33 IoT work with Blynk
#include <WiFiNINA.h>
#include <BlynkSimpleWiFiNINA.h>
char auth[] = "YourBlynkProjectCode";
char ssid[] = "YourWifiID";
char pass[] = "YourWiFiPassword";
Adafruit_BME280 bme; // use I2C interface
Adafruit_Sensor *bme_temp = bme.getTemperatureSensor();
Adafruit_Sensor *bme_pressure = bme.getPressureSensor();
Adafruit_Sensor *bme_humidity = bme.getHumiditySensor();
#define SDA_PIN 5
#define SCL_PIN 4
#define RESET_PIN -1
#define OLED_ADDR -1
#define FLIP180 0
#define INVERT 0
#define USE_HW_I2C 0
#define MY_OLED OLED_128x64
#define OLED_WIDTH 128
#define OLED_HEIGHT 64
SSOLED ssoled; // instance of OLED
BlynkTimer timer; // instance of Blynk timer
void setup() {
if (!bme.begin(0x76)) { // wait until sensor is detected
while (1) delay(10);
}
bme_temp->printSensorDetails();
bme_pressure->printSensorDetails();
bme_humidity->printSensorDetails();
oledInit(&ssoled, MY_OLED, OLED_ADDR, FLIP180, INVERT, USE_HW_I2C, SDA_PIN, SCL_PIN, RESET_PIN, 400000L);
oledFill(&ssoled, 0x0, 1);
Blynk.begin(auth, ssid, pass); // comment this line out to operate weather station without Blynk
timer.setInterval(60000L, myupdate); // runs myupdate once per minute
myupdate(); // run an initial update of display and data to Blynk because main loop waits one minute
}
void loop() {
Blynk.run(); // Blynk prefers to run by itself in the main loop.
timer.run(); // Everything else is handled through Blynk timer
}
// this routine is called by the Blynk timer to update both the OLED display and push data to Blynk
void myupdate(){
sensors_event_t temp_event, pressure_event, humidity_event;
bme_temp->getEvent(&temp_event);
bme_pressure->getEvent(&pressure_event);
bme_humidity->getEvent(&humidity_event);
float ctemp = temp_event.temperature; // get temp in centigrade
float ftemp = 32 + (9*ctemp)/5; // convert temp to fahrenheit
float hum = humidity_event.relative_humidity; // get relative humidity
float ppress = pressure_event.pressure; // get pressure in mm
float mpress = 1.3 + ppress/33.8939; // convert to inch Hg and add 1.3 to match actual locally reported barometric
// pressure. You may want to remove the 1.3 and/or add your own adjustment.
char mytemp[8];
dtostrf(ftemp, 6, 2, mytemp); // convert temp to a string
char myhum[8];
dtostrf(hum, 6, 2, myhum); // convert humidity to a string
char mypress[8];
dtostrf(mpress, 6, 2, mypress); // convert pressure to a string
// update OLED display
oledWriteString(&ssoled, 0,2,1,(char *)"Weather Station", FONT_NORMAL, 0, 1);
oledWriteString(&ssoled, 0,2,3,(char *)"Temp = ", FONT_NORMAL, 0, 1);
oledWriteString(&ssoled, 0,50,3,(char *)mytemp, FONT_NORMAL, 0, 1);
oledWriteString(&ssoled, 0,105,3,(char *)"F", FONT_NORMAL, 0, 1);
oledWriteString(&ssoled, 0,2,5,(char *)"Humid=", FONT_NORMAL, 0, 1);
oledWriteString(&ssoled, 0,50,5,(char *)myhum, FONT_NORMAL, 0, 1);
oledWriteString(&ssoled, 0,105,5,(char *)"%", FONT_NORMAL, 0, 1);
oledWriteString(&ssoled, 0,2,7,(char *)"Press=", FONT_NORMAL, 0, 1);
oledWriteString(&ssoled, 0,50,7,(char *)mypress, FONT_NORMAL, 0, 1);
oledWriteString(&ssoled, 0,105,7,(char *)"in", FONT_NORMAL, 0, 1);
// push new weather data to Blynk
Blynk.virtualWrite(V3, ftemp);
Blynk.virtualWrite(V4, hum);
Blynk.virtualWrite(V5, mpress);
}
Schematics
Manufacturing process
- Building an Outdoor Weather Station with Raspberry Pi 2 and ADS‑WS1
- Build a Raspberry Pi Weather Station that Emails Daily Weather Data
- Advanced Weather Station v2.0: Real‑Time Temperature, Pressure, Humidity & Altitude Monitoring
- Build a $10 Portable Arduino Weather Station (AWS) – Easy DIY with Nano, DHT22, BMP180 & LCD
- Arduino Nano Weather Station: Sensor Kit & OLED Display
- Build a Reliable Arduino Weather Station with DHT Sensors
- Build a Compact Weather Station with Arduino Nano – Easy DIY Guide
- Build a Smart Weather Station with Arduino UNO and AWS Integration
- Build a Simple Weather Station with Arduino UNO, BMP280 Sensor & LCD
- Arduino Wireless Weather Station: DIY Portable Weather Monitoring Kit