


Using Vibration Analysis and Cross‑Channel Phase to Spot Equipment Issues
Modern vibration data collectors routinely support multiple simultaneous sensors, enabling the powerful cross‑channel phase analysis feature.
To perform cross‑channel phase you only need one additional cable and sensor beyond the standard analyzer and vibration‑route cable.
Cross‑channel phase can uncover structural looseness, integrity issues, misalignment, and resonance conditions that are otherwise hard to detect.
How Does It Work?
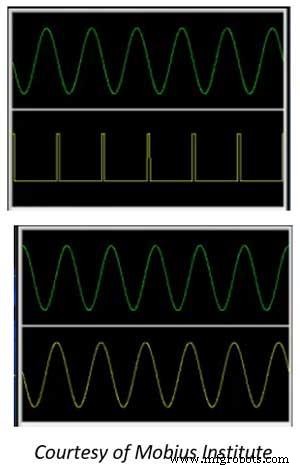
Normal route acquisition separates overlapping sine waves by frequency, displaying each as a distinct spectral peak.
Phase analysis isolates a single frequency and measures its motion relative to a reference. The reference may be a tachometer pulse from reflective tape, a key phaser, or another vibration signal in a cross‑channel setup.
When a tachometer pulse creates a square wave and the vibration signal a sine wave, their peak timings are compared. The resulting time difference is expressed in degrees, reflecting rotational motion.
For rotating equipment, a leading edge of reflective tape produces a tachometer pulse; the subsequent vibration peak indicates the heavy spot on the shaft. (This article does not cover conditions where the heavy spot does not align with the vibration high spot, but be aware that this can occur.)
With two sensors in a cross‑channel arrangement, the analyzer compares the vibration peaks of each signal. The user can specify the target frequency—most often the shaft speed.
A typical approach places sensor A at the motor’s outboard vertical end and sensor B on the motor foot, then observes their relative phase. One sensor can remain fixed while the other is moved to additional points.
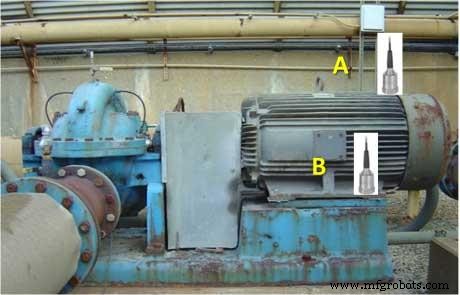
If sensor B reads ±30° relative to sensor A, the two points move in unison—a normal condition. A ±180° reading indicates out‑of‑step motion, often caused by a crack that allows the housing to separate, usually near the foot. Record the finding for later analysis.
Moving sensor B to the foot bolt: a zero‑degree reading means the bolt’s plate moves with the motor top, implying a tight fastener. Conversely, a ±180° shift between foot and bolt signals looseness at that location.
Apply the same logic to the base and floor: if all points match sensor A’s reading, no relative looseness exists.
Next, reposition sensor A to the motor inboard end and repeat the checks. Then move sensor A across the coupling to the pump inboard and outboard ends, documenting each result.
After assessing individual components, compare readings along the machine train in both vertical and horizontal directions. A machine can be vertically aligned yet horizontally misaligned, so both axes are essential.
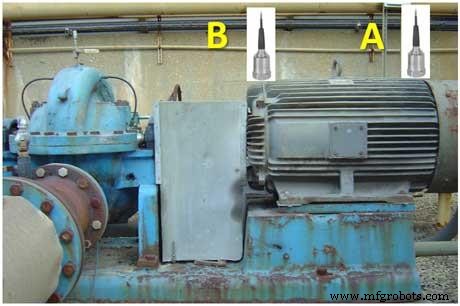
Assuming sensor A stays fixed at zero degrees, move sensor B from bearing to bearing along the train. A zero‑degree reading at a bearing confirms correct alignment; a ±180° reading suggests the end is moving opposite the reference, indicating angular misalignment.
For example, if sensor B shows ±180° at the pump inboard bearing, expect a zero‑degree reading at the pump outboard bearing. Consistent in‑phase readings across all bearings confirm proper alignment.
Repeat the procedure horizontally by positioning sensor A at the motor’s outboard horizontal point and roaming sensor B along the same side, then across to the opposite side. Document every reading.
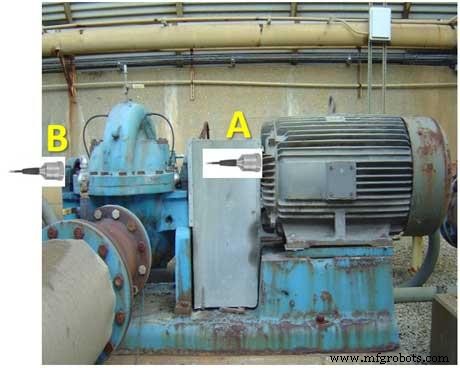
Axial phase measurements offer additional insight. Place sensor A at the motor inboard bearing and sensor B at the pump outboard bearing in the axial direction. In‑phase readings are normal; a ±180° shift signals angular misalignment, as the shafts push against each other during rotation.
Cross‑channel phase also evaluates the machine base’s structural integrity. Mount sensor A vertically on the motor’s outboard bearing and roam sensor B along the base in 2‑ to 3‑inch increments.
Consistent in‑phase readings indicate no flex. A 90° or 180° shift between the front and back of the base suggests significant flex or a structural defect. A 180° shift from the front to the corresponding back position is typically a red flag, as it implies the base is bending in opposite directions.
What About Amplitude?
Phase readings come with two key metrics: the phase angle in degrees and the vibration amplitude. Some analyzers label this as “Peak & Phase,” where the peak represents the maximum vibration at the selected frequency.
In the illustration below, circles on the base show phase direction (tic mark) while the inner value displays velocity in inches per second. The amplitude rises from 0.114 in/s at the left edge to 0.954 in/s near the center, then falls again on the right. Because the phase remains constant, this pattern indicates a stiffness issue rather than resonance.
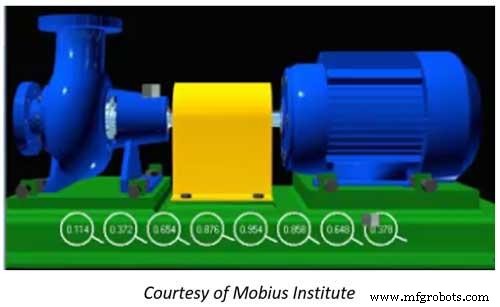
Such a localized stiffness problem often points to inadequate grouting or missing reinforcement. Engage an engineer to design a reinforcement that improves stiffness without compromising other areas.
Summary
Cross‑channel phase is an indispensable feature of modern two‑channel analyzers, empowering technicians to detect, confirm, and document machinery problems early. A solid understanding of normal machine motion is essential for accurate interpretation.
Equipment Maintenance and Repair
- Maintaining an Accurate Equipment Registry: Best Practices for Reliability and Compliance
- Criticality Analysis: Identifying & Prioritizing High‑Risk Equipment
- Vibration Analysis Fundamentals: A Practical Guide for Predictive Maintenance
- Eliminating Fan Vibration: A Practical On‑Site Balancing Solution
- Essential Guide: When and How to Safely Use a Fire Extinguisher
- How to Detect Overheating Damage on Circuit Boards: A Practical Guide
- How to Use a Tool Sensor on Your Wood CNC Router
- How Vibration Analysis Drives Predictive Maintenance Success
- Water Flow Sensors: How They Work & How to Use Them
- Optimize Your Parts with Mold Flow Analysis: A Comprehensive Guide