


Microprocessor Debugging: 1980–2016 – A Comprehensive History
Since the dawn of electronics design, bugs have been inevitable, and debugging has been the essential discipline to wrestle faults and errors to determine which will prevail—and how thoroughly.
Debugging technology has evolved as fascinatingly as the designs it supports. From simple stimulus–response–observe approaches to today’s sophisticated tools, equipment, and methodologies, the field has grown in tandem with increasingly complex systems. In 2017, a new era began with the introduction of debug over functional I/O, promising even greater efficiency and capability.
After decades of global innovation, I’ve been involved in debugging since 1984. To appreciate the paradigm shift we now experience, it’s useful to revisit the milestones that shaped the industry.
1970s–1980s
System design then differed markedly from today. A typical board comprised a CPU, (EP)ROM, RAM, and peripheral ICs such as PICs, UARTs, DMA controllers, timers, and I/O devices, each implemented on separate chips.
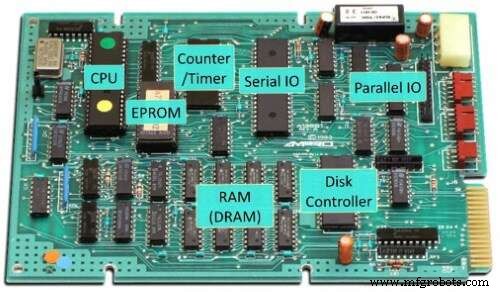
1980s single-board computer (SBC)
(Source: https://oldcomputers.net/ampro-little-board.html)
Developers wrote code in assembly or C, compiled, linked, and produced a HEX file for the ROM image. The process involved manually erasing EPROMs with a UV eraser, programming them via a serial or parallel interface, and re‑installing the chips on the board. If the program didn’t behave as expected, several debugging techniques were available.
Code Inspection: The most fundamental approach, still used by many, involves stepping through code mentally or with a text editor, a skill that remains valuable when tools are unavailable or too costly.
LEDs: A classic method uses on‑board LEDs or other indicators to signal program state. By inserting LED toggles at key points, developers can visually trace execution flow. When additional I/O pins and a logic analyzer are available, real‑time state tracing becomes possible.
On‑target Monitor: Boards with a serial port and sufficient memory could host a small monitor program. By jumping into this monitor, a developer could step through assembly, inspect registers and memory via RS‑232 commands such as s (step) or m 83C4,16 (display memory).
In‑Circuit Emulator (ICE): For those who could afford it, the ICE was the ultimate debugger. It replaced the CPU with an emulation circuit that could observe and control internal signals. Although large and expensive—often costing thousands of dollars—ICEs provided advanced breakpoints, trace, and the ability to swap EPROMs with emulation RAM, eliminating the need to erase and re‑flash during development.
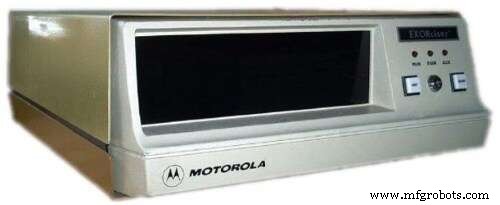
Motorola Exorciser ICE
(Source: https://www.exorciser.net/personal/exorciser/Original%20Files/exorciser.jpg)
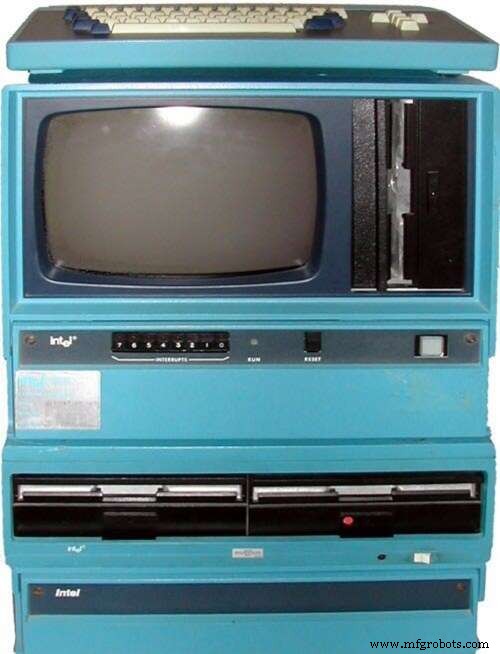
Intel MDS ICE
(Source: https://www.computinghistory.org.uk/userdata/images/large/PRODPIC-731.jpg)
1982–1990
Three key changes emerged for embedded developers:
- Integrated ICs: CPUs began to include peripherals—e.g., the Intel 80186/80188 (an evolution of the 8086/8088), Zilog Z180 (from the Z80), and Motorola CPU32 family (e.g., 68302) from the 68000.
- Affordable ICEs: Manufacturers produced lower‑cost ICEs without bond‑out chips, reducing price to under $10,000 for an 80186 ICE.
- Clock‑speed challenges: Rising CPU speeds strained ICE cabling and control logic. The solution was on‑chip debug circuitry (OCD), providing single‑step, register access, and breakpoints at full CPU speed, though early implementations lacked full trace capability.
OCD access typically used proprietary interfaces such as Background Debug Mode (BDM) or the more common JTAG, traditionally used for production test. While some tools could access memory while the CPU ran, others could not, leading to variation across implementations.
1990–2000
External trace became impractical due to high clock speeds and internal cache. Instead, manufacturers introduced compressed core trace data—capturing only non‑sequential program counter changes and compressing them for off‑chip transport. This allowed the debugger to reconstruct execution paths using knowledge of the running program. Key architectures included IBM’s PowerPC, Motorola’s ColdFire, and ARM’s 7TDMI cores.
2000–2010
Compressed trace datasets enabled on‑chip trace buffers like ARM’s Embedded Trace Buffer (ETB), accessible via JTAG. The buffer’s size could be configured, balancing silicon area against trace performance. Multi‑core SoCs introduced new challenges: JTAG scan chains disappeared when cores powered down. ARM’s CoreSight architecture solved this by providing a single JTAG‑based debug access port that could reach all memory‑mapped CoreSight components, including multiple cores that could power cycle independently.
2010–Present
With the rise of 64‑bit cores and widespread Linux/Android use, on‑device debug gained traction. Kernel drivers now expose CoreSight components, enabling on‑target trace capture via the perf subsystem. The ARM Embedded Logic Analyzer (ELA) brings back the richness of early ICEs, offering complex breakpoints, triggers, and internal SoC signal access—all within the silicon.
After 40 years of relentless innovation, the field stands on the brink of a new chapter: debugging and tracing over existing functional I/O. This shift promises leaner solutions that reduce development time and cost while enhancing capability, continuing the long war against bugs.
Embedded
- Microprocessor Programming Fundamentals
- C++ Hello World Tutorial: Step‑by‑Step Code, Setup & Explanation
- Essential G‑Code Commands to Append After Your CNC Program Ends
- Master G02/G03 Circular Interpolation in CNC: Step‑by‑Step Example
- Fanuc G90 Turning Cycle: CNC Program Example for Efficient Turning Operations
- Haas M98 Subprogram Call: Practical Guide & Sample Code
- Step-by-Step Guide: Mill a Full Circle on CNC Machines Using Practical G‑Code
- Beginner’s Guide to G‑Code Milling: A Practical Sample Program
- Fanuc G73 Pattern Repeating Cycle: Complete CNC Programming Example
- Loading G-Code Part Programs in Mach3: A Step-by-Step Guide