


Tableau: Turning Raw Data into Strategic Insight
Tableau excels at translating complex data sets into clear, actionable visuals that resonate with non‑technical stakeholders. While SQL drives the heavy lifting behind analytics, Tableau’s drag‑and‑drop interface makes it possible for anyone to create compelling charts and dashboards.
Why Tableau Matters for Business Communication
Many professionals have struggled to turn raw numbers into an engaging narrative. One common scenario is a request for a simple pie chart or sales forecast line graph that turns into an Excel headache. According to Gartner, 71% of senior executives say that data visualization tools help them make faster decisions. Tableau delivers exactly that.
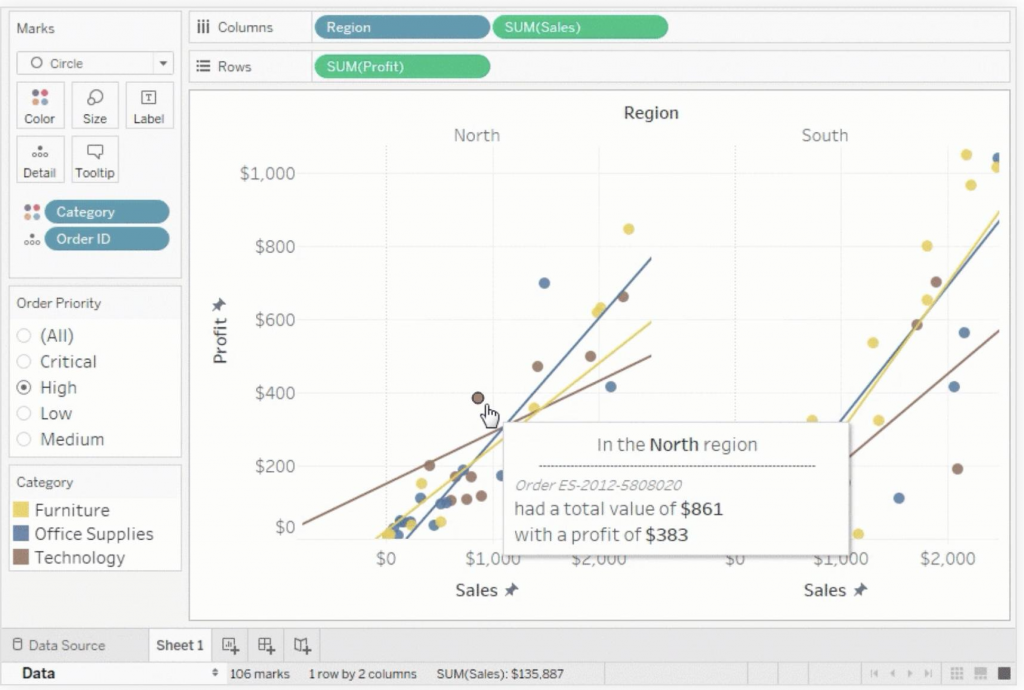
When a slide is filled with a raw table of numbers, the audience’s attention quickly fades. Tableau transforms those numbers into intuitive visuals—bar charts, heat maps, geographic maps—that instantly convey the story behind the data.
Bridging the Gap Between Analytics and Decision‑Making
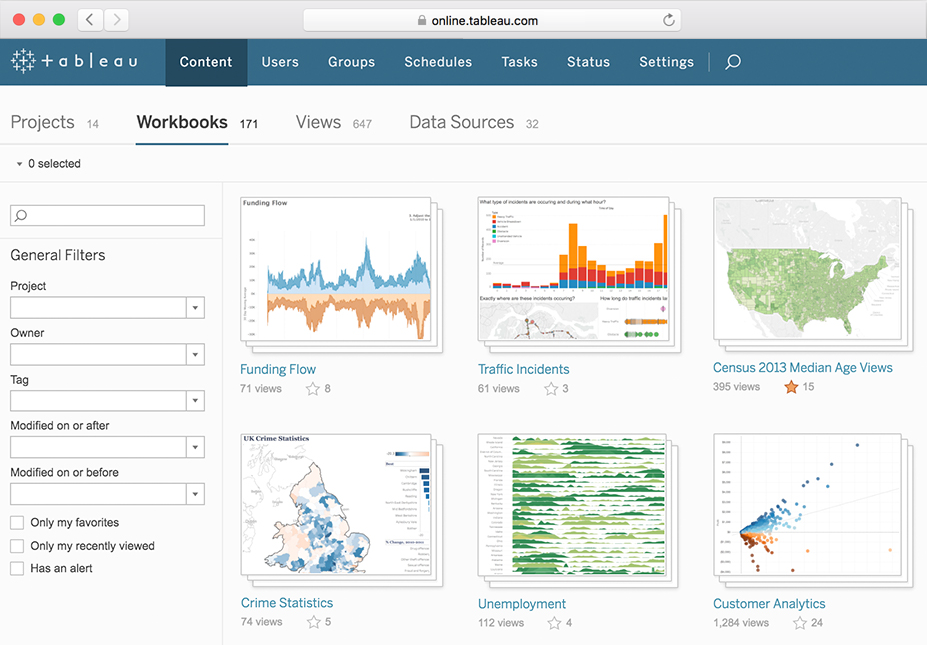
Tableau’s user‑friendly experience means that team members can explore data without routing requests through IT. This reduces bottlenecks and empowers business units to generate insights on the fly.
It’s a misconception that Tableau and Excel are mutually exclusive. Excel remains indispensable for complex calculations and modeling, while Tableau shines when the goal is to present the findings. Together, they cover the full spectrum of data work.
Impactful Visuals for Every Stakeholder
Different departments have distinct data needs. For example:
- Production: Geographic mapping of machine downtime.
- Sales: Market‑price comparisons and discount impact.
- Finance: Forecasting capital expenditure versus return on investment.
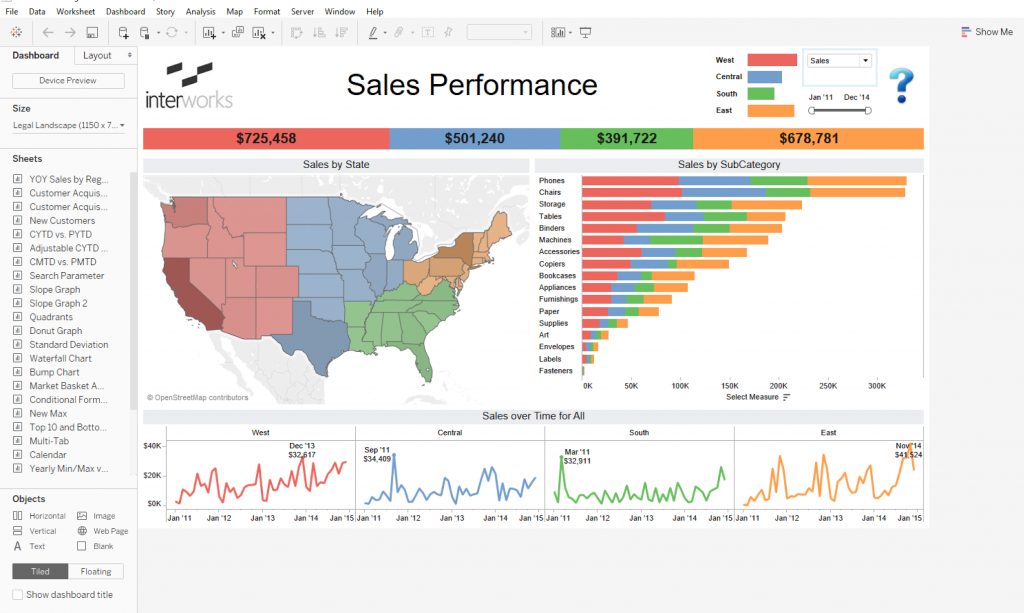
Tableau’s dashboards allow a single dataset to be sliced and diced in multiple ways, ensuring that each audience sees the metrics most relevant to them.
Geospatial visualizations are a standout feature. Building a map in Excel requires significant manual effort; Tableau natively supports mapping, enabling rapid deployment of location‑based insights.
Cost vs. Value: Is Tableau Worth It?
While Tableau’s licensing can be higher than other tools, the return on investment is clear. Faster decision‑making, reduced reliance on IT, and increased stakeholder engagement often offset the initial expense. Many organizations report a payback period of under two years.
Practical Use Cases
Consider a manufacturing plant looking to improve Overall Equipment Effectiveness (OEE). A pie chart can highlight downtime categories, but a drill‑down bar chart allows operators to see root causes per machine. Dragging a filter onto the canvas instantly shifts the view, turning a static report into a dynamic story.
In virtual meetings, such interactive visuals can dramatically increase engagement and lead to quicker consensus.
Future‑Proofing Your Data Strategy
With sensor networks and IoT devices generating more data than ever, the ability to present complex insights simply and effectively is paramount. Tableau’s support for real‑time data streams ensures that dashboards stay current without manual refreshes.
Ultimately, Tableau empowers decision makers to view the full context of their data—whether that’s a single KPI or a multi‑layered business model—enabling informed actions that drive results.
Author: Joseph Zulick, Manager at MRO Electric and Supply
Internet of Things Technology
- The Fourth Industrial Revolution: How Industry 4.0 Is Reshaping Manufacturing
- Ensuring Data Compliance in the Internet of Things
- Harnessing Data in the Internet of Reliability: Strategies for Effective Management
- Predictive Maintenance: Harnessing Industry 4.0 for Uninterrupted Production
- Democratizing the Internet of Things: Next‑Gen Satellite IoT Brings Universal, Affordable Connectivity
- Unlocking the Value of IoT Data: Secure, Insight‑Driven Strategies
- Why Analog Measurements Drive Plant Performance
- The Future of Data Centers: Trends, Tech, and Sustainability
- Navigating IT Challenges in Modern Manufacturing: Strategies for Digital Transformation
- ERP Systems: The Backbone of Industry 4.0 Data Integration