


Understanding Standing Waves and Resonance in Transmission Lines
When an impedance mismatch occurs between a transmission line and its load, reflected waves arise. For a continuous AC source, the incident and reflected waves interfere to form stationary patterns known as standing waves.
In the diagram below, a triangle‑shaped incident waveform is reflected at the unterminated end of the line, producing a mirror‑image reflection. The transmission line is drawn as a single thick line for clarity.
The incident wave travels from left to right, while the reflected wave travels from right to left, as illustrated in the figure below.
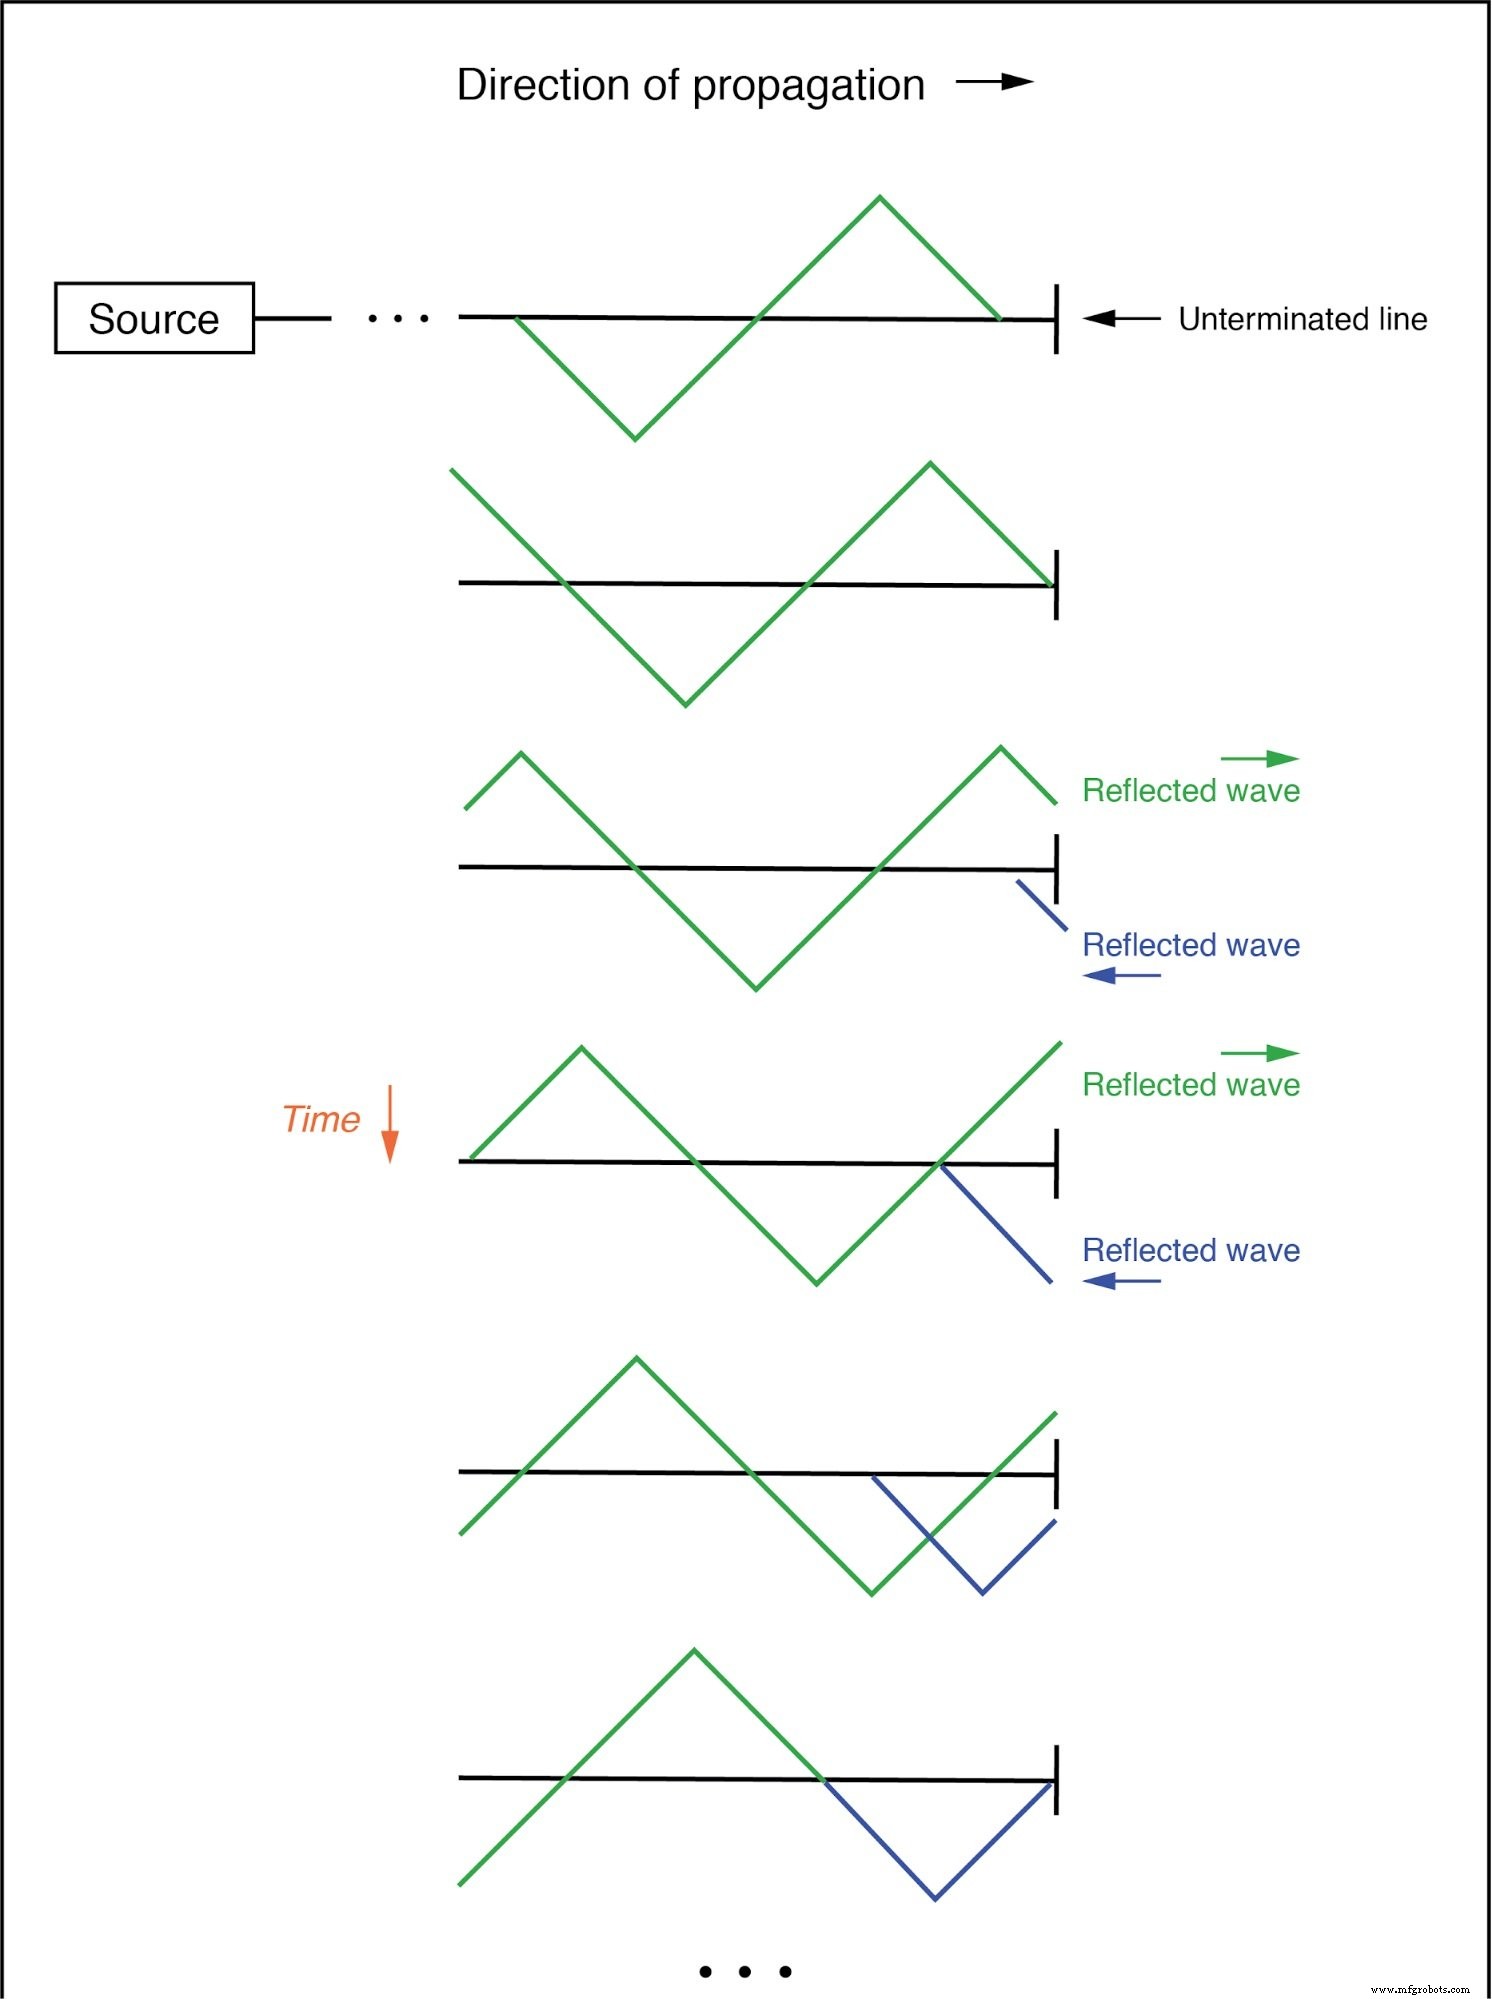
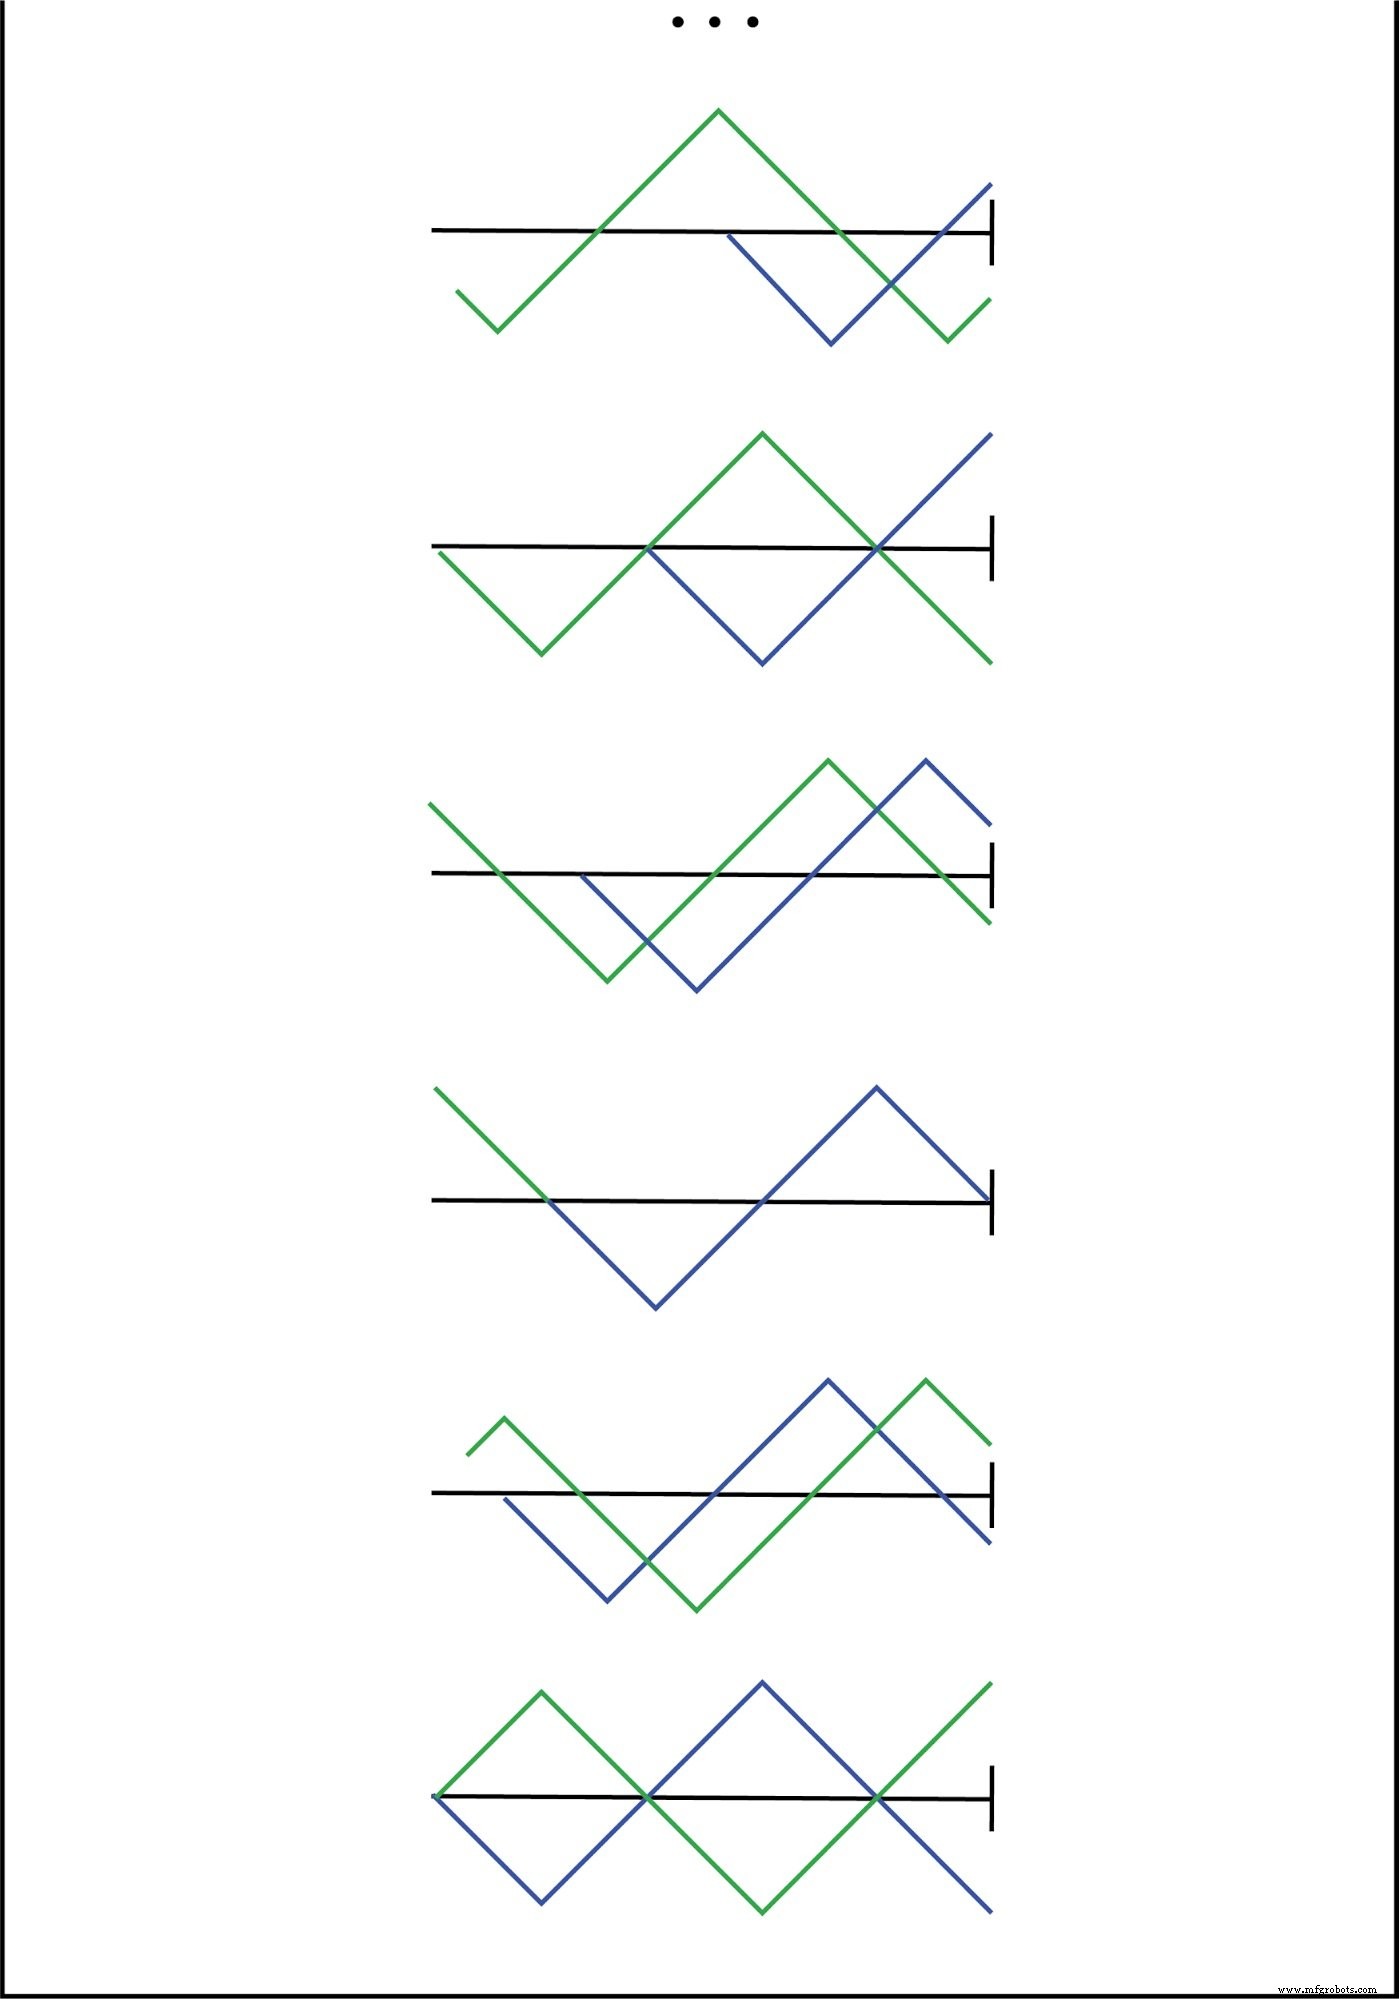
Incident wave reflects off the end of an unterminated transmission line.
If we add the two waveforms together, we find that a third, stationary waveform is created along the line’s length, as shown in the figure below.
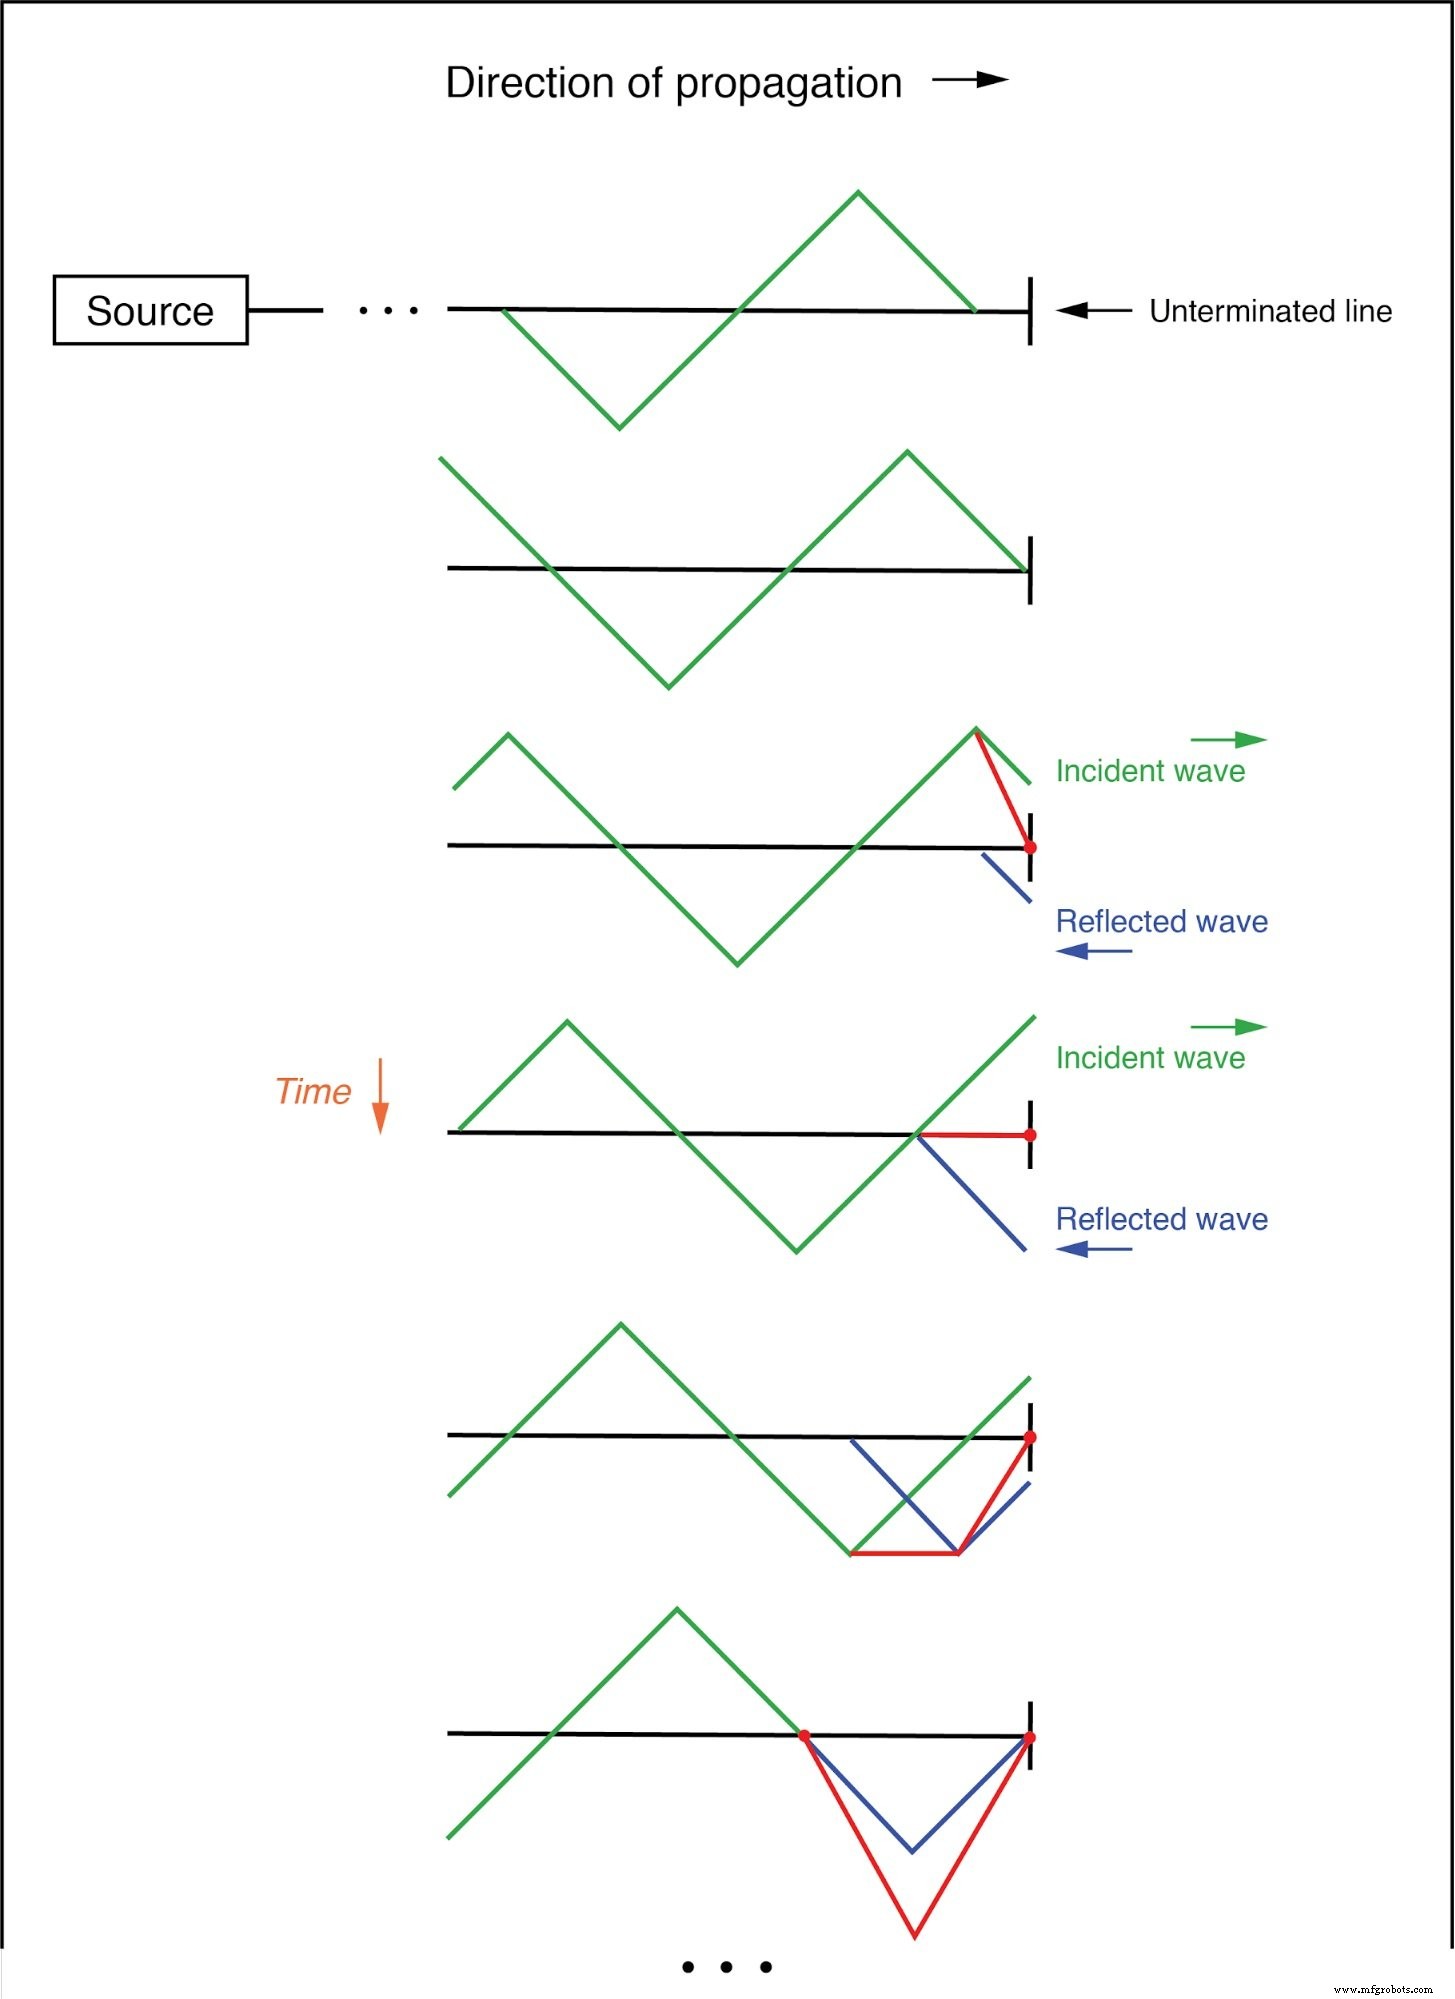
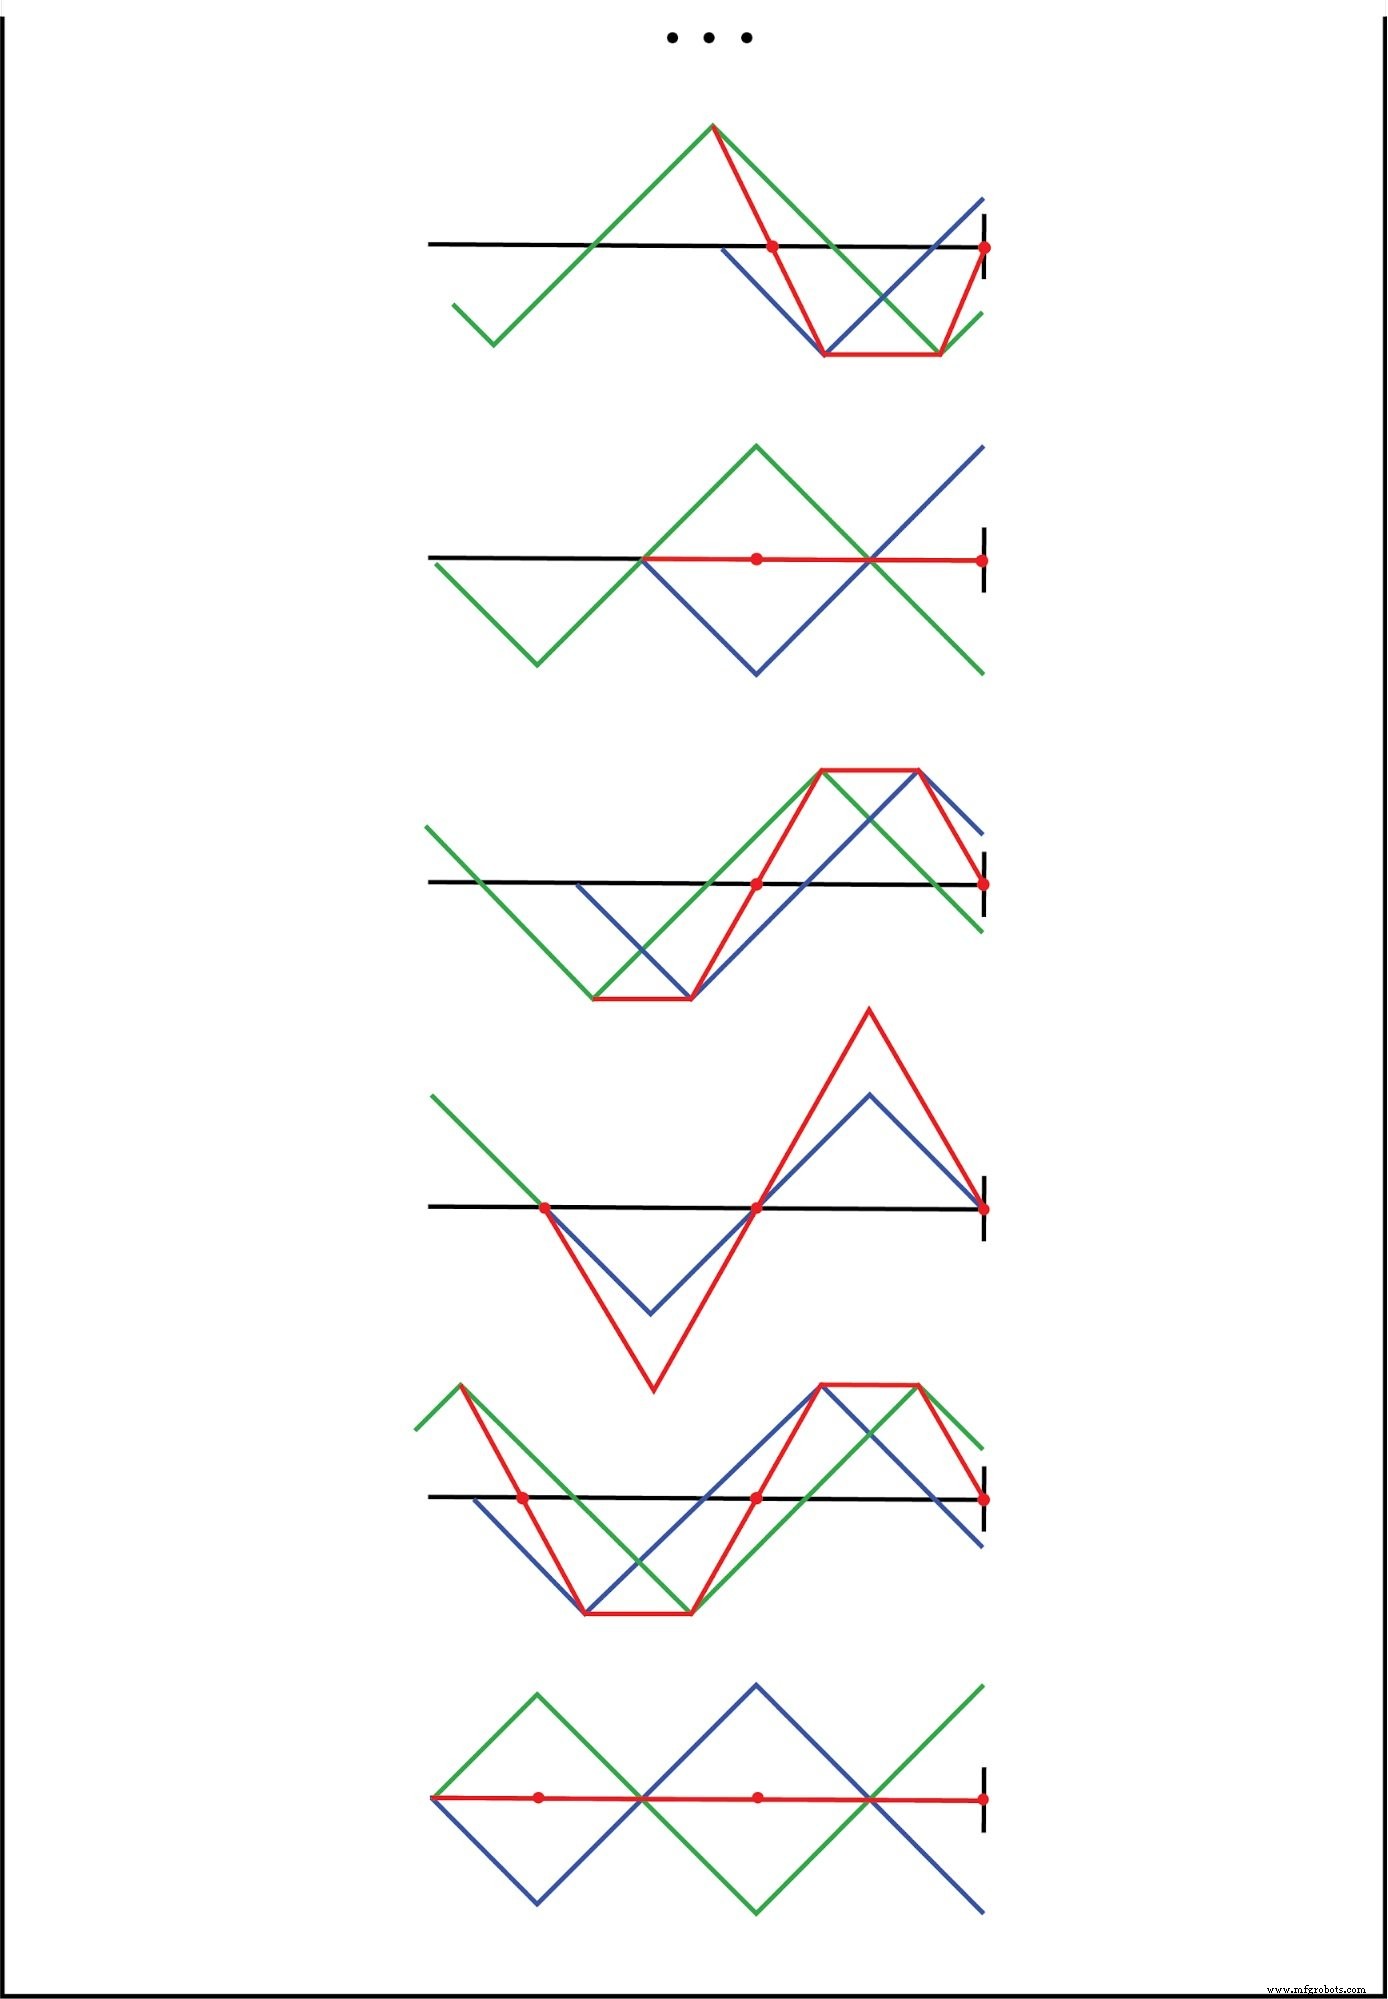
The sum of the incident and reflected waves is a stationary wave.
This stationary wave, the “standing wave,” represents the net voltage along the line. It oscillates in magnitude but does not propagate along the cable as the incident or reflected waves do.
Notice the dots marking the “zero” points of the standing wave—where the incident and reflected waves cancel each other. These points never move, as illustrated below.
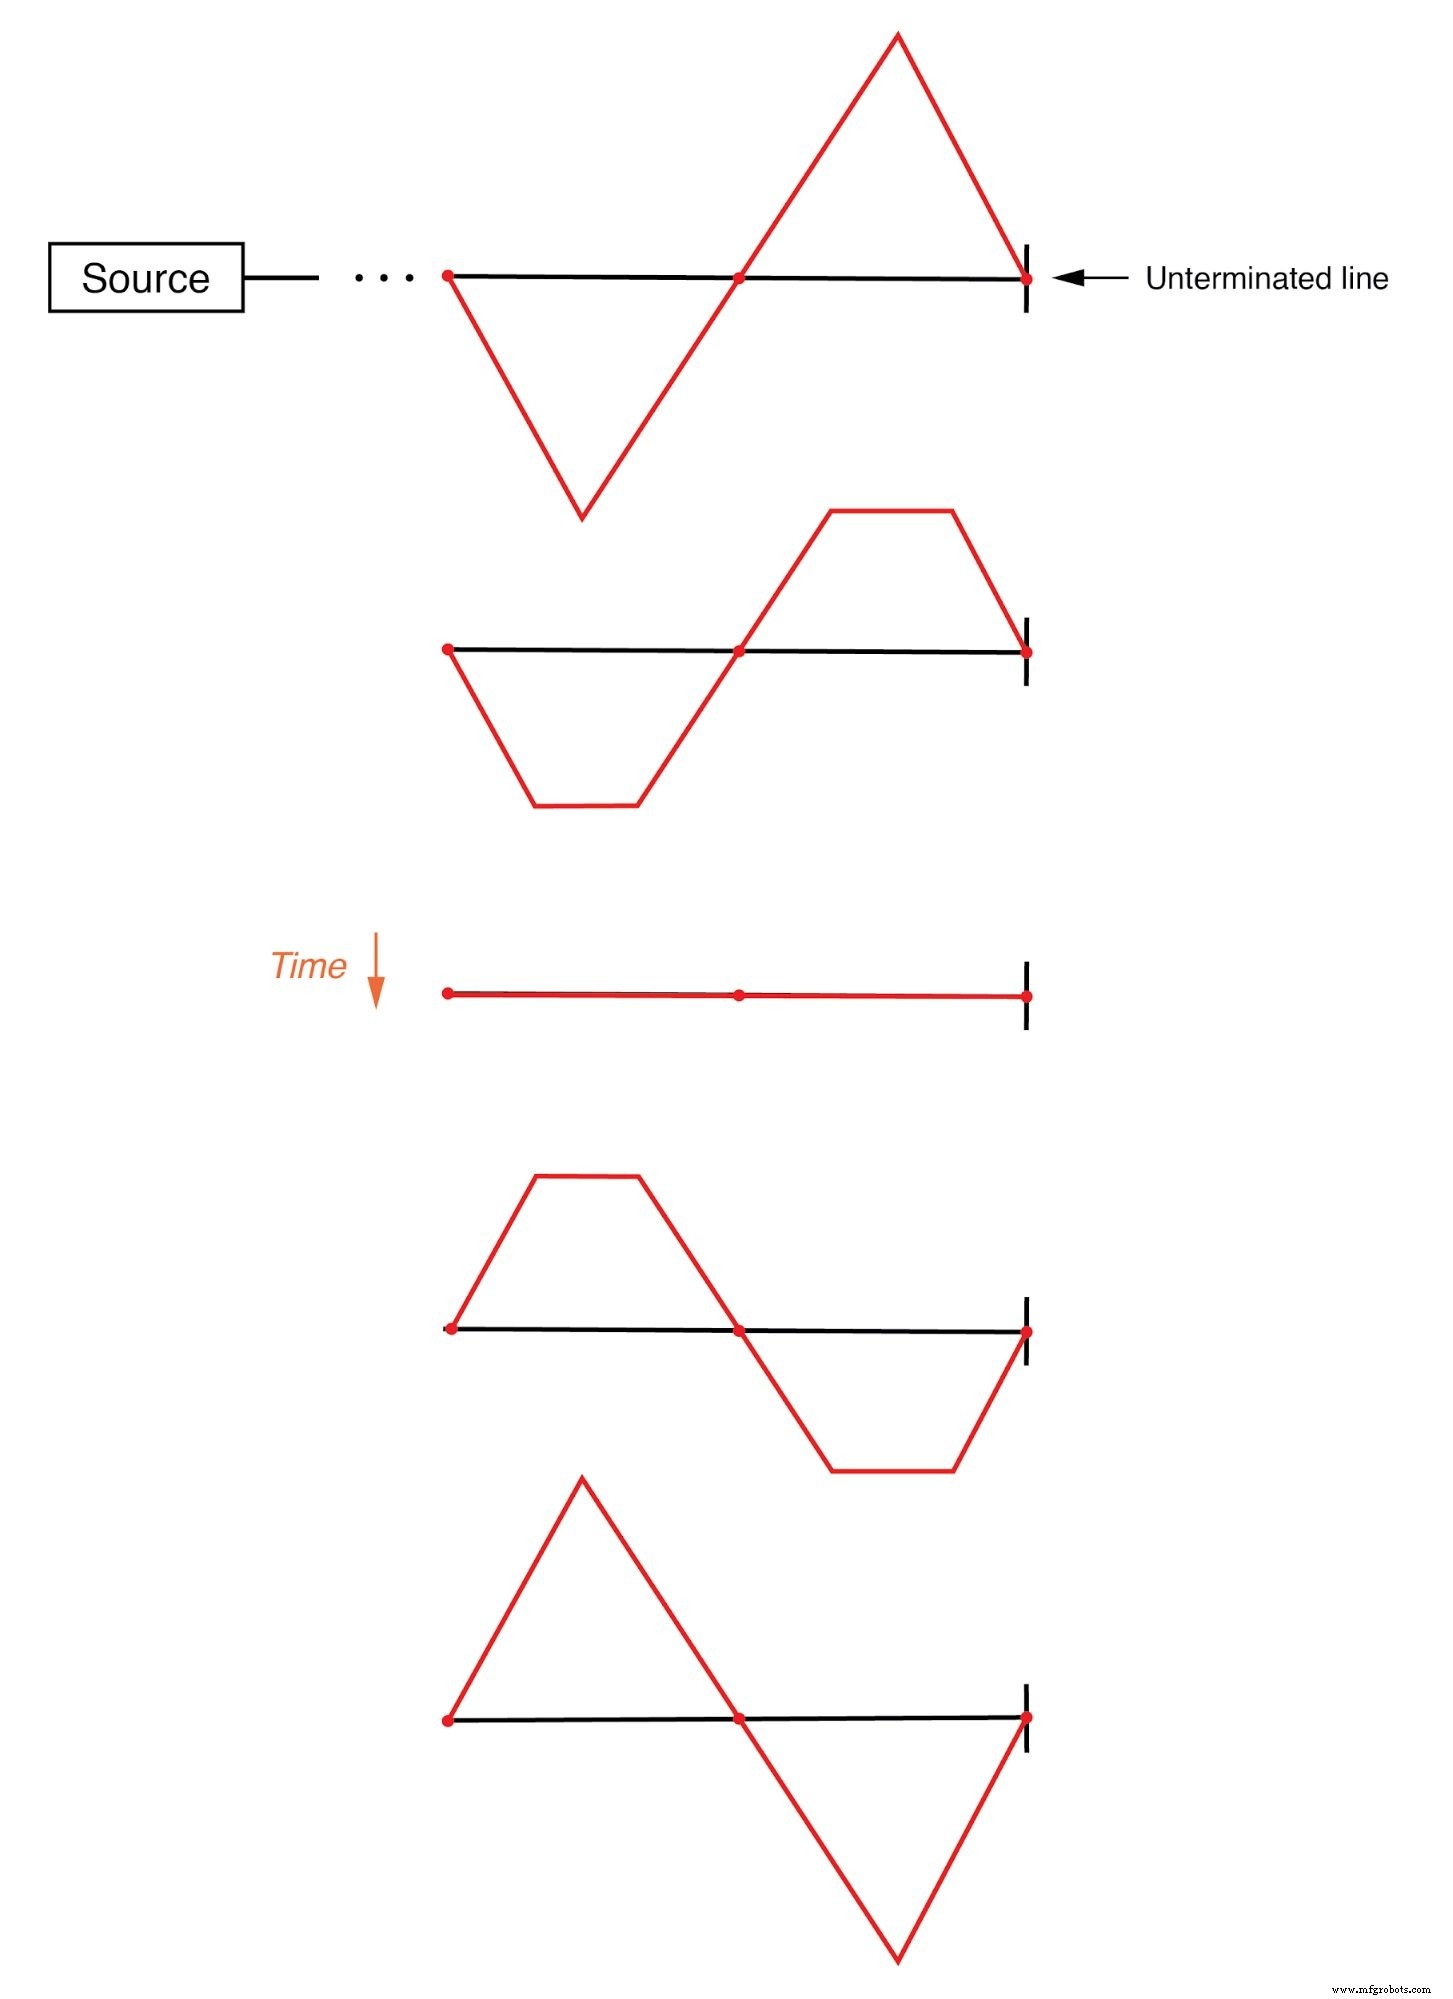
The standing wave does not propagate along the transmission line.
Cases Where a Standing Wave Is Produced
Standing waves appear in many physical systems. For instance, a string or rope that is shaken at one end while the other end is fixed will produce a standing wave pattern, with nodes (points of minimal motion) and antinodes (points of maximum motion) that remain fixed along the length of the string. The effect is most pronounced when the driving frequency matches one of the string’s natural frequencies.
Plucked strings exhibit a similar standing‑wave behavior, but the pluck supplies the string’s own resonant frequency, ensuring maximum constructive interference.
Wind blowing across an open‑ended tube also creates standing sound waves. Whether a node or antinode appears at the tube’s end depends on whether the end is open (antinode) or closed (node).
In all these systems, the standing‑wave pattern is determined by the boundary conditions at the ends.
Progression of Harmonics of Resonant Frequencies
For any standing‑wave system, multiple resonant frequencies exist—each corresponding to an integer multiple of the fundamental (lowest) frequency. These higher frequencies are called harmonics or overtones.
In an open‑ended pipe, the first harmonic occurs when a quarter of a wavelength fits into the pipe’s length; the next harmonics are at one half, three‑quarters, and so on. The exact frequencies depend on the pipe’s physical length and the speed of sound in the medium.
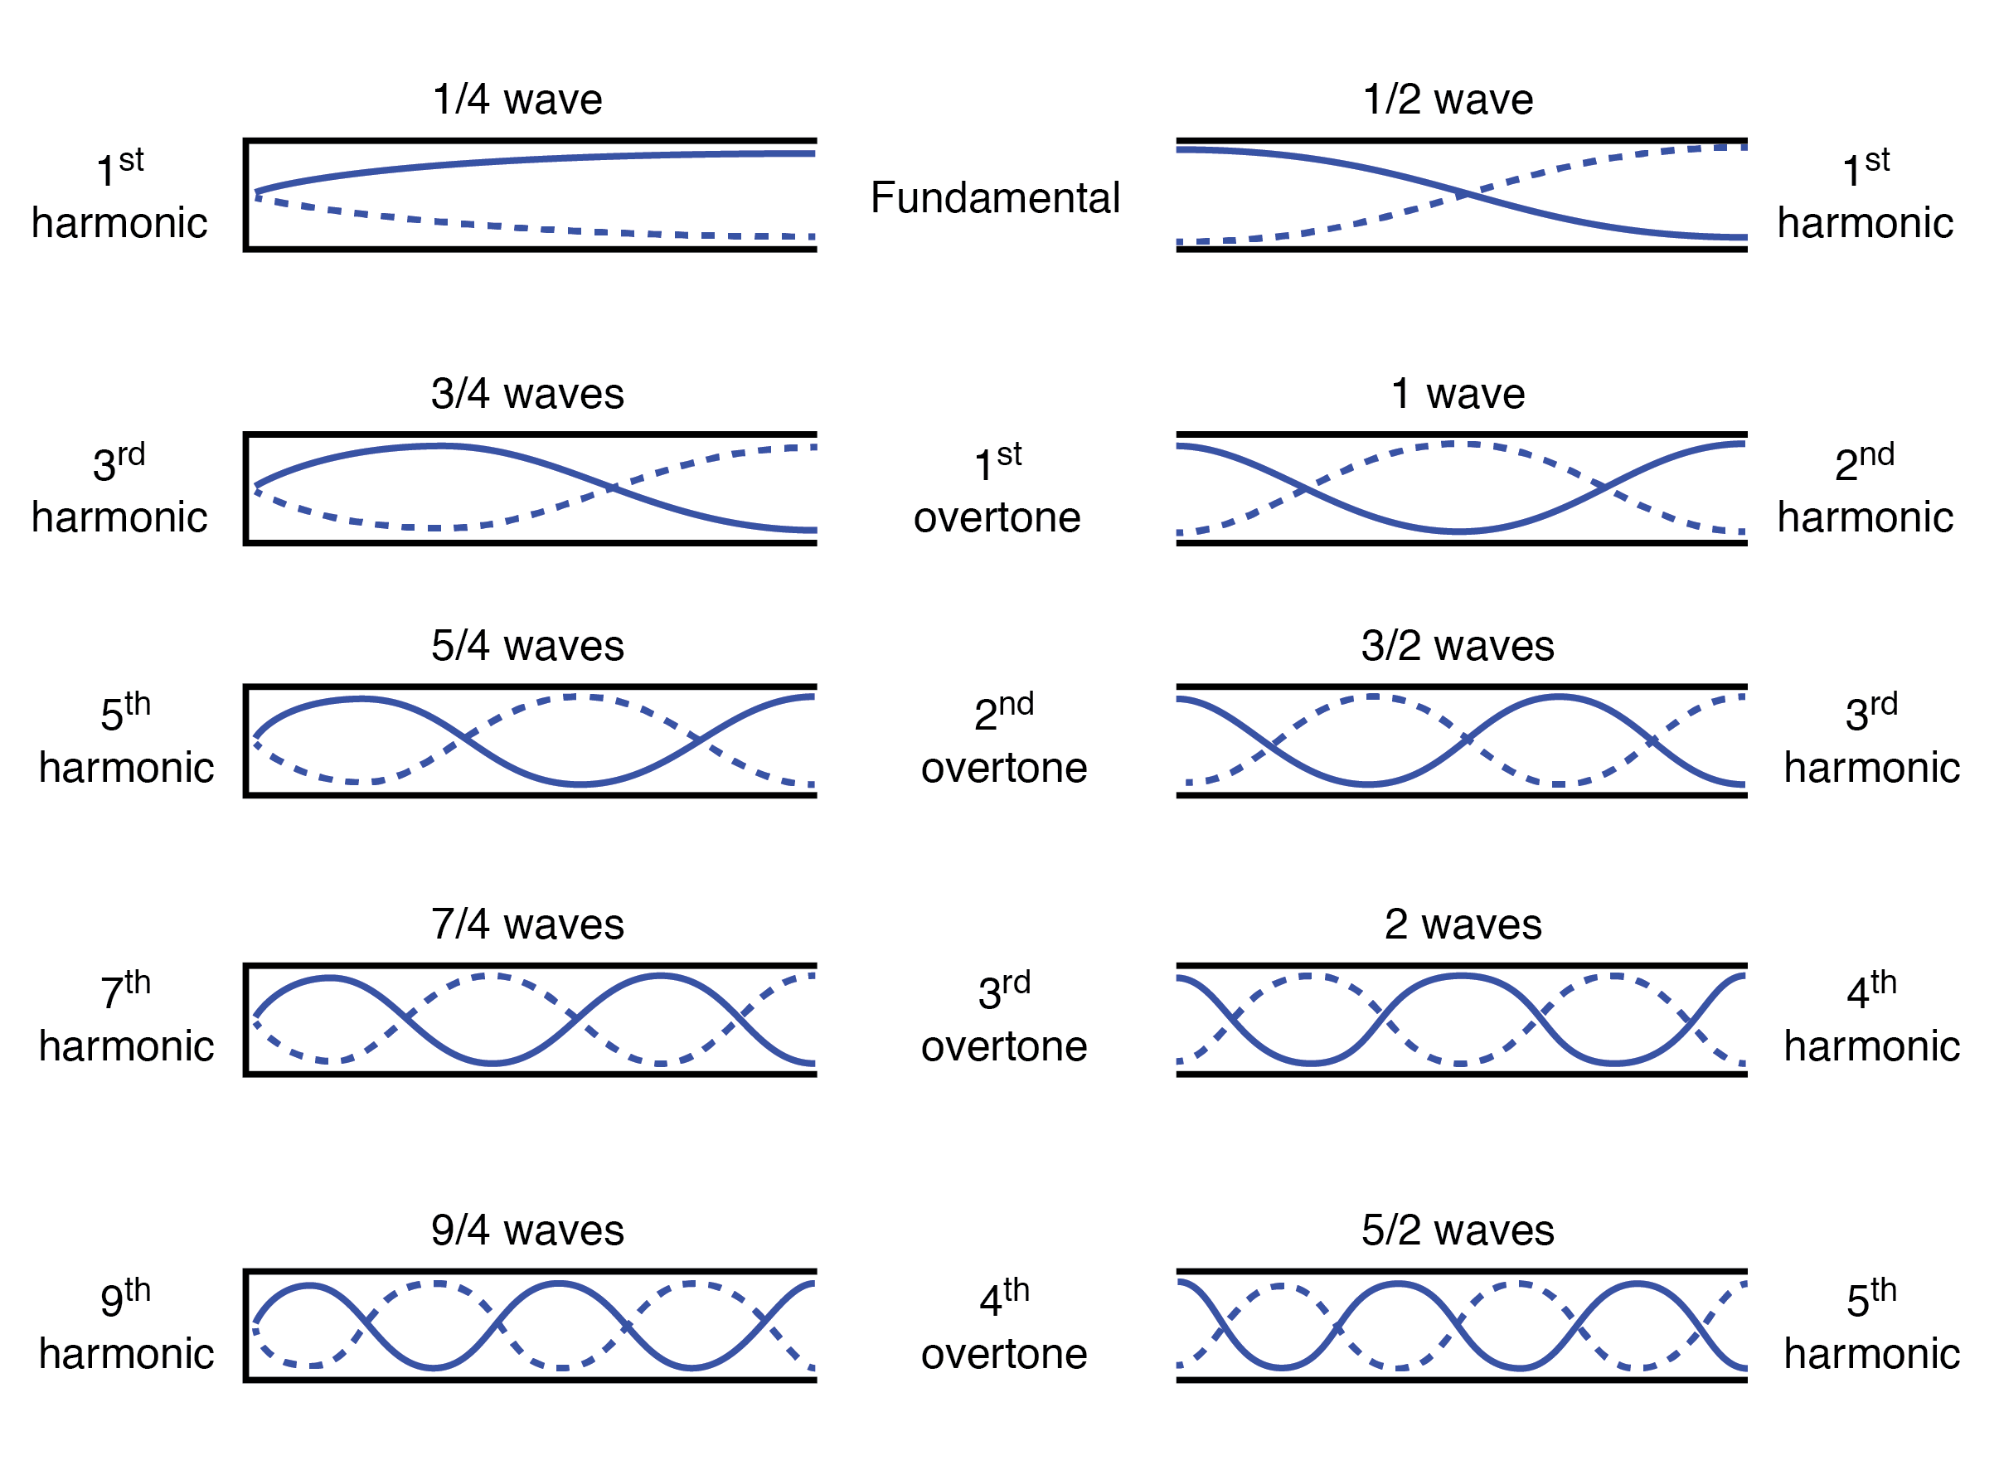
Harmonics (overtones) in open‑ended pipes
Simulating Transmission‑Line Resonance with SPICE
Transmission lines support standing waves, and these waves are constrained by the termination impedance. When the termination does not match the line’s characteristic impedance, resonance occurs at frequencies determined by the line’s length and the propagation velocity of the signal.
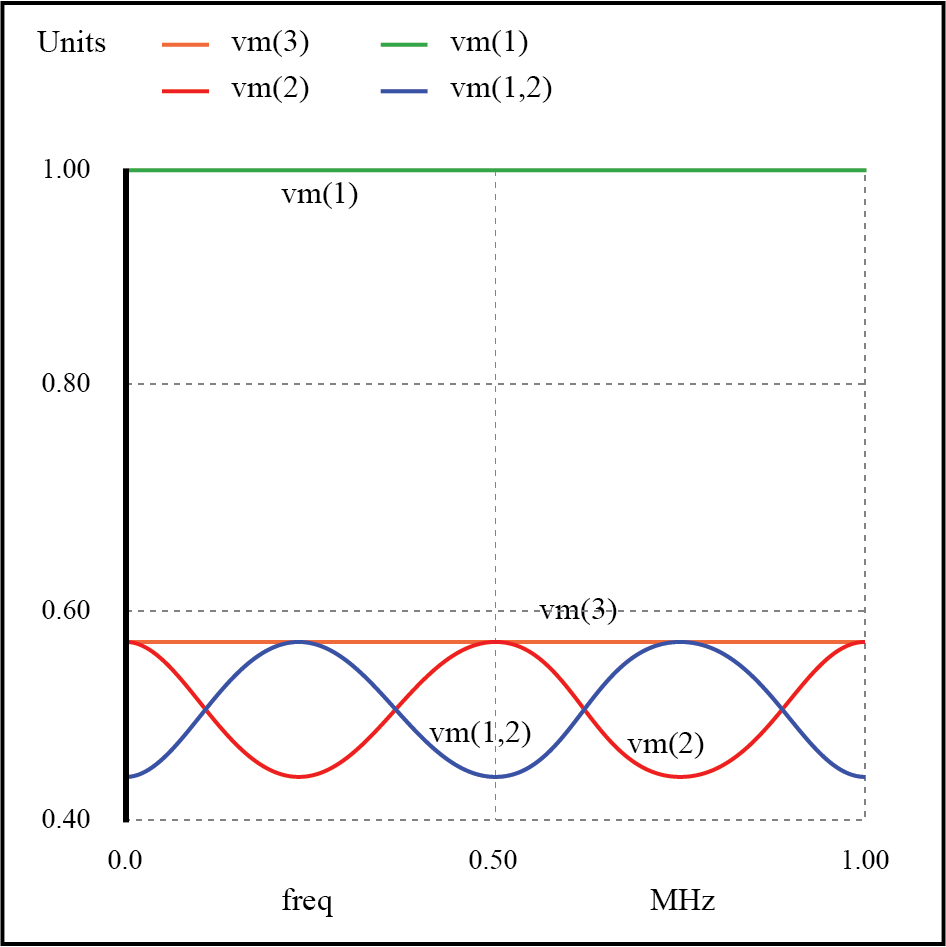
To illustrate, consider a perfectly matched system: a source, a 75 Ω transmission line, and a 75 Ω load. The SPICE netlist below models this scenario.
Transmission line
v1 1 0 ac 1 sin
rsource 1 2 75
t1 2 0 3 0 z0=75 td=1u
rload 3 0 75
.ac lin 101 1m 1meg
* Using “Nutmeg” program to plot analysis
.end
In this model, the line has a characteristic impedance of 75 Ω and a propagation delay of 1 µs, which corresponds to a physical length of about 648 ft for a coaxial cable with a velocity factor of 0.66.
Running the simulation and plotting the source voltage, the line’s source‑end voltage, and the load voltage shows that the source voltage remains at 1 V while the other nodes stay at 0.5 V. No resonances appear because the line is perfectly matched.
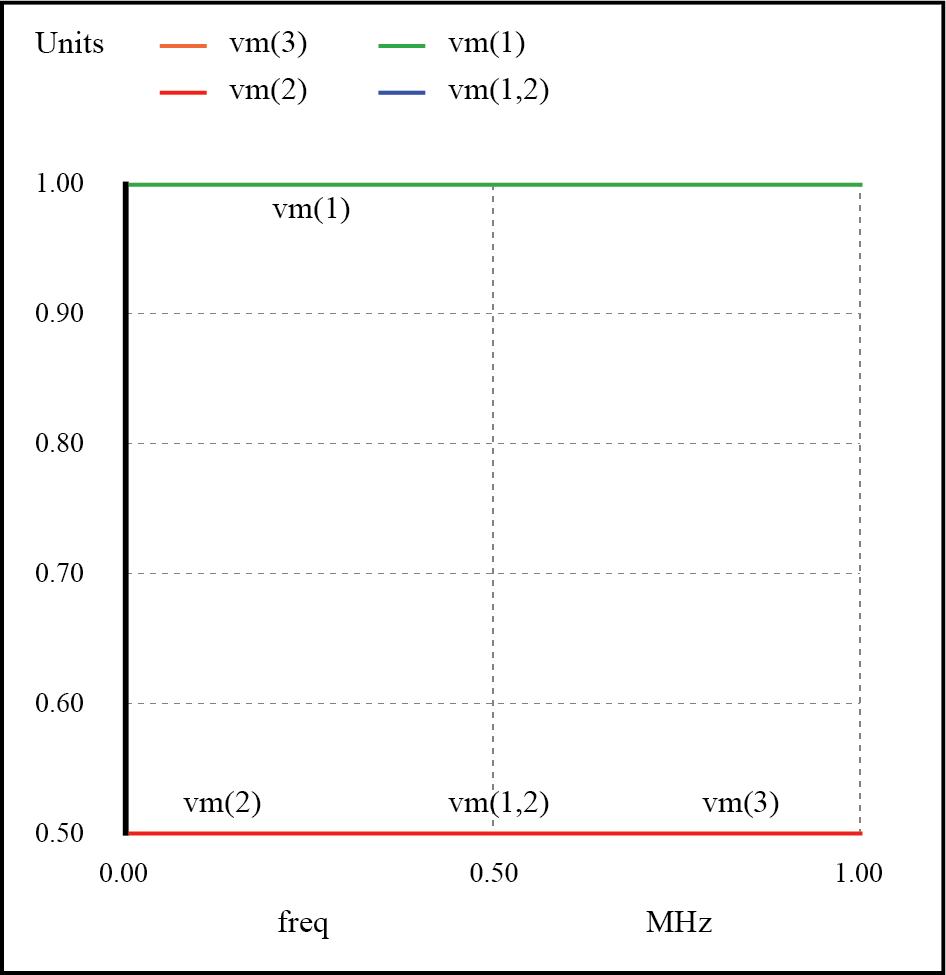
No resonances on a matched transmission line.
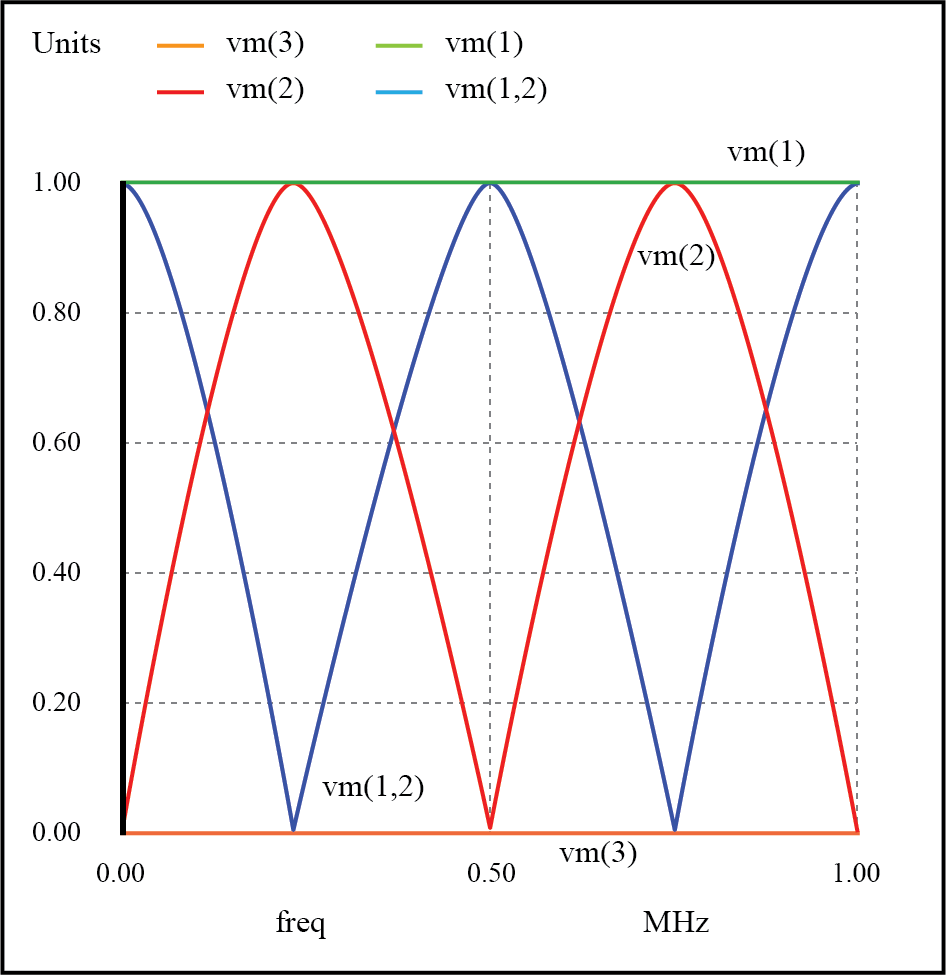
When the load is changed to an open circuit (≈999 MΩ), reflections are inevitable, and resonant peaks appear in the frequency sweep from 1 mHz to 1 MHz.
Transmission line
v1 1 0 ac 1 sin
rsource 1 2 75
t1 2 0 3 0 z0=75 td=1u
rload 3 0 999meg
.ac lin 101 1m 1meg
* Using “Nutmeg” program to plot analysis
.end
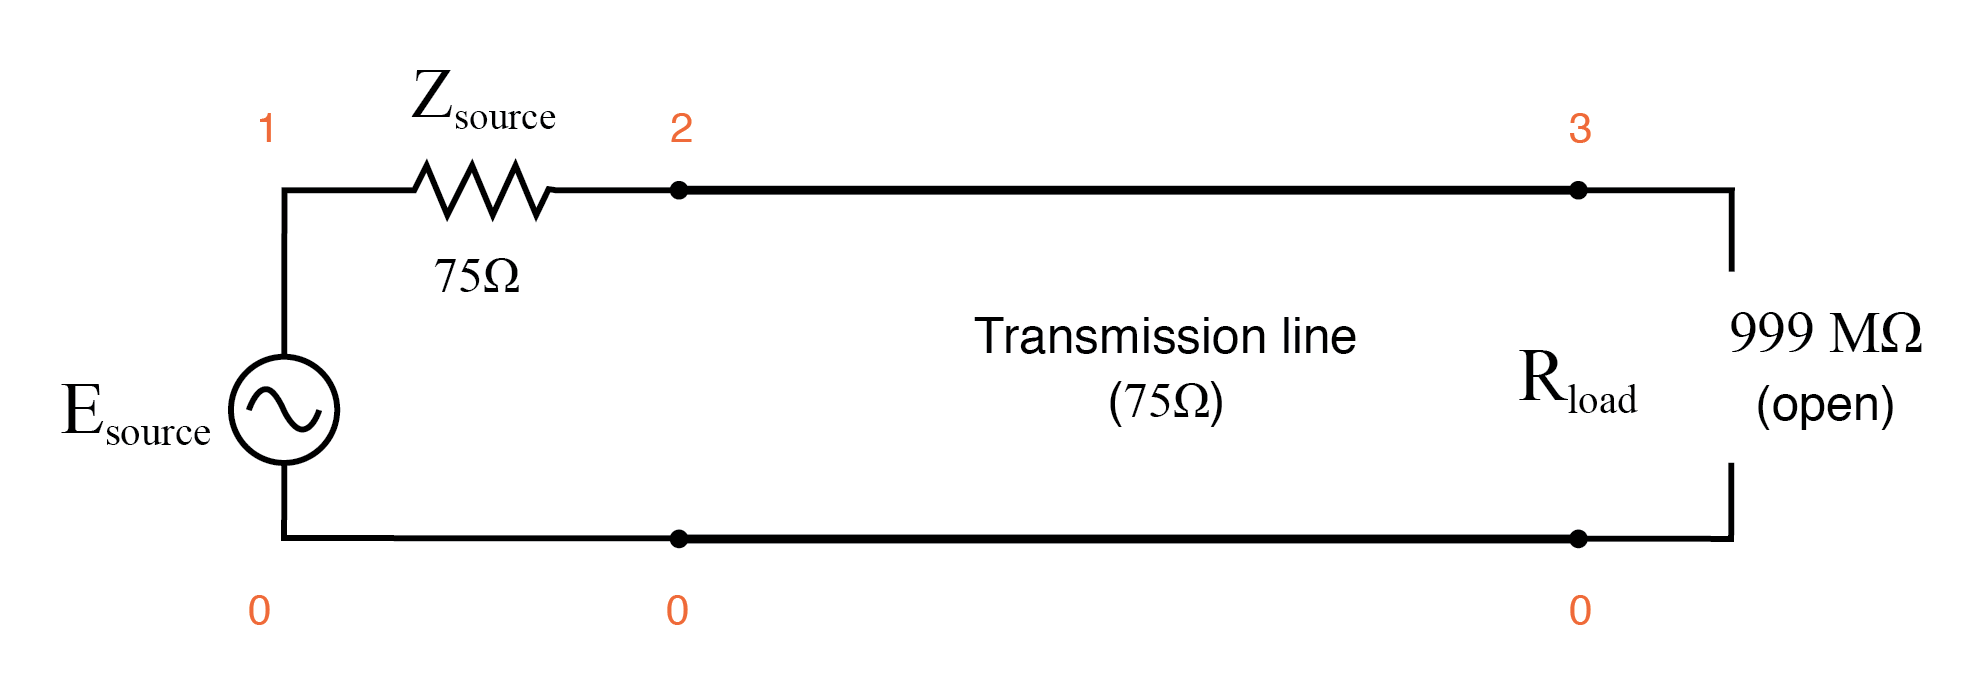
Open‑ended transmission line.
The analysis reveals five key frequencies: 0 Hz, 250 kHz, 500 kHz, 750 kHz, and 1 MHz. At each of these points, the voltage and current distribution along the line changes in a predictable way, reflecting the standing‑wave pattern.
For example, at 250 kHz, the line length equals a quarter of a wavelength. The load end becomes a voltage antinode (maximum voltage) and a current node (zero current). Consequently, the source sees an open circuit, even though the load is physically open.
At 250 kHz: source sees an open circuit.
At 500 kHz, the line hosts a half‑wave standing pattern, with the source end again acting as a voltage antinode and current node.
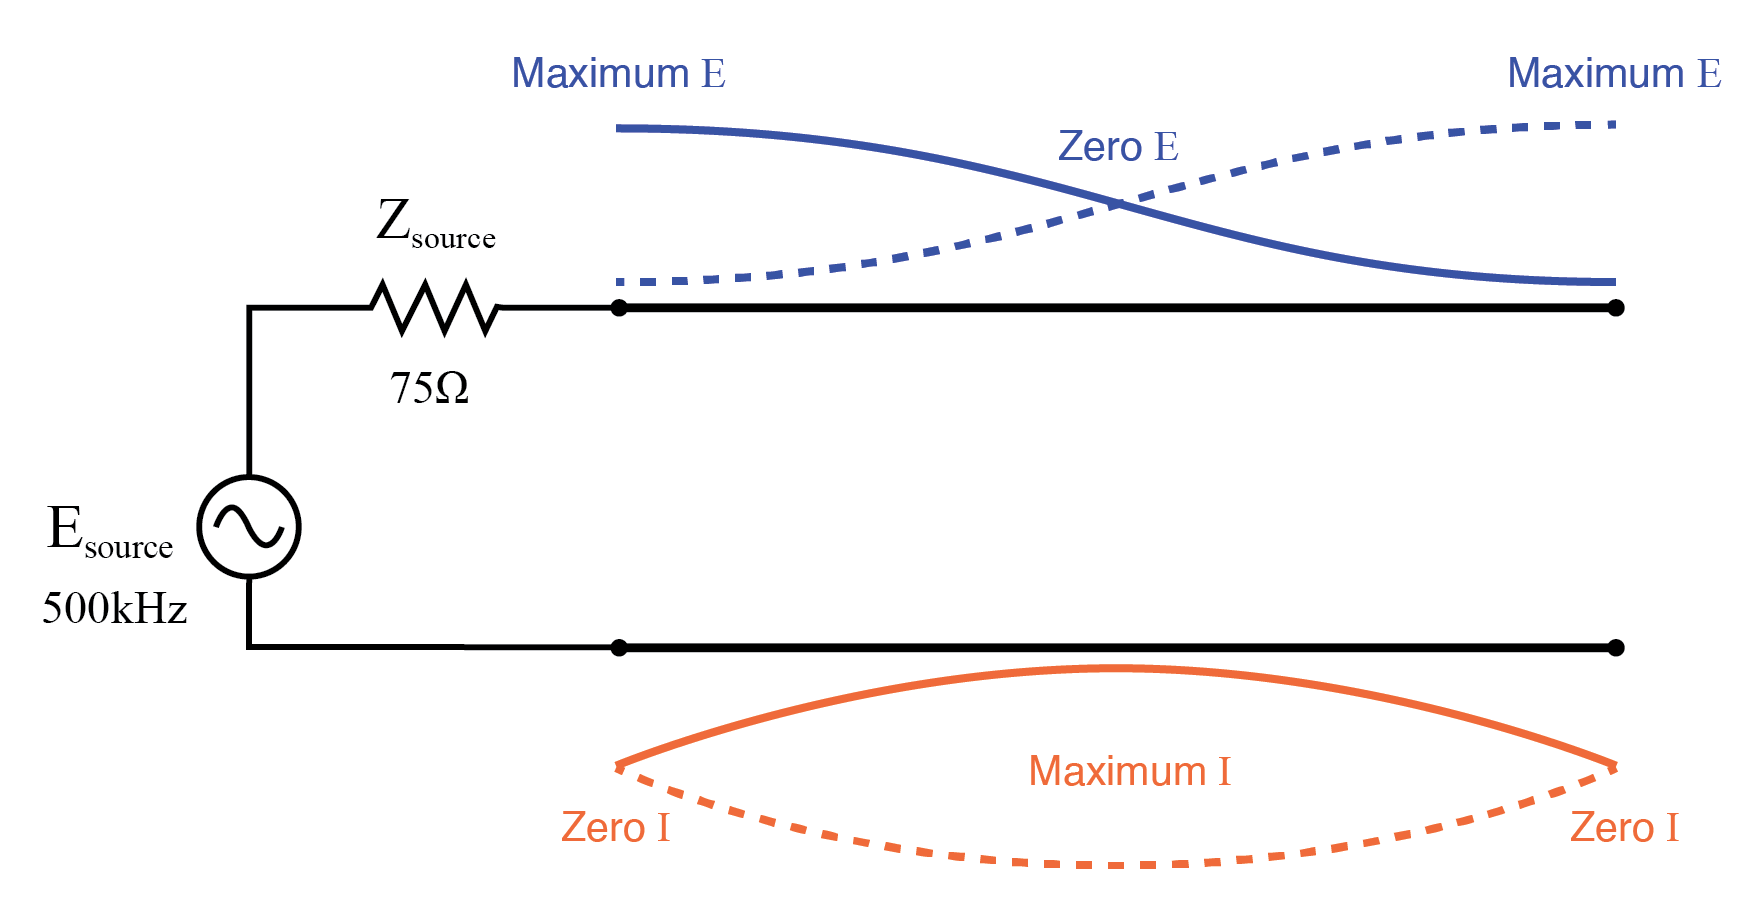
Half‑wave standing wave on the line.
When the load is shorted (≈1 µΩ), the roles of voltage and current nodes swap: the shorted end becomes a voltage node and a current antinode.
Transmission line
v1 1 0 ac 1 sin
rsource 1 2 75
t1 2 0 3 0 z0=75 td=1u
rload 3 0 1u
.ac lin 101 1m 1meg
* Using “Nutmeg” program to plot analysis
.end
Short‑circuited transmission line.
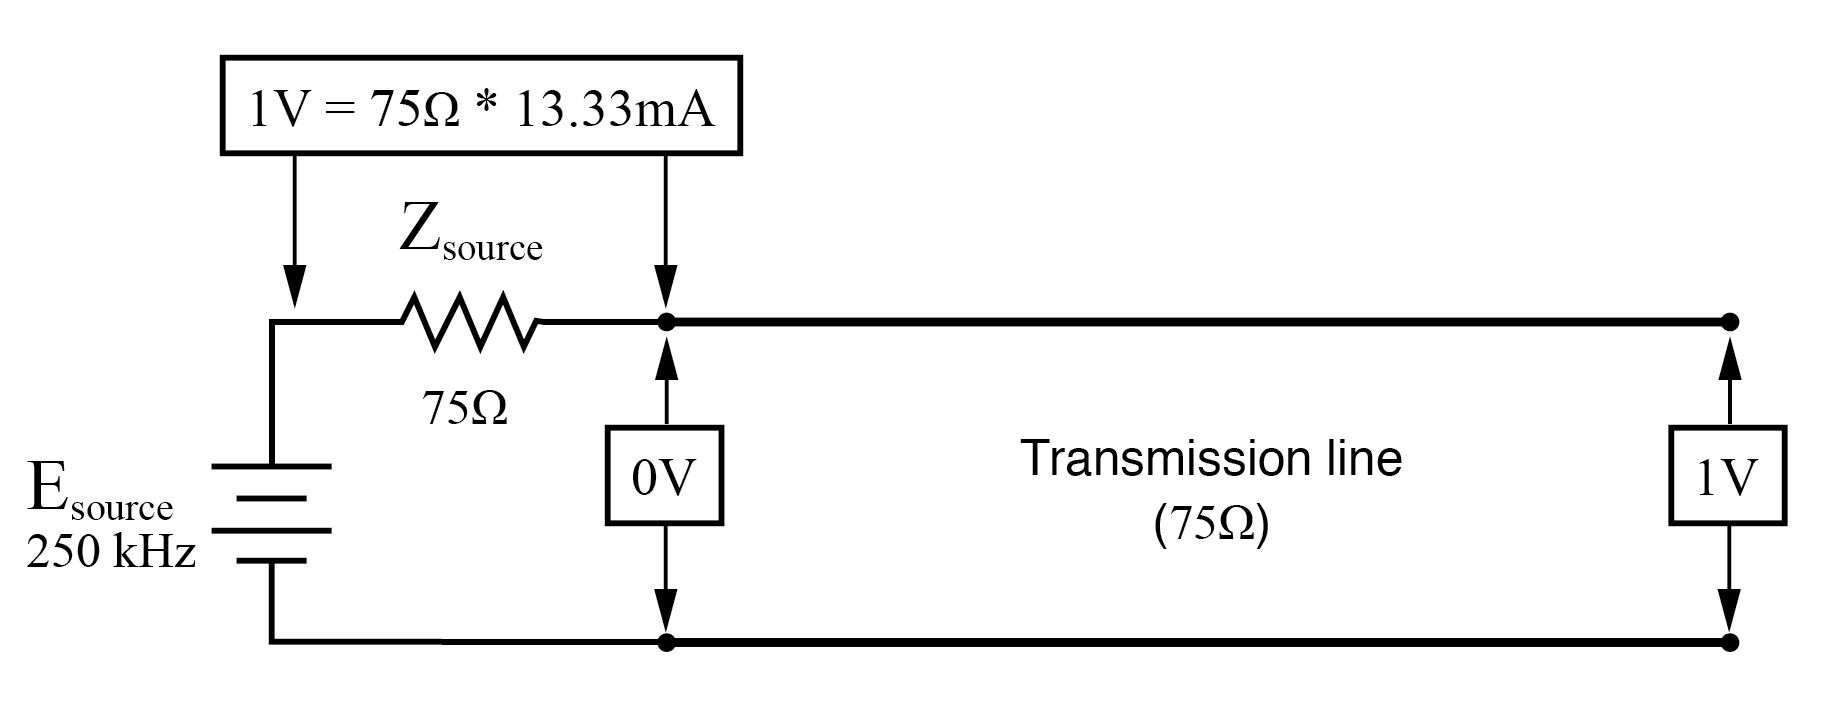
Even with a partially matched load—say, 100 Ω on a 75 Ω line—standing waves persist, but the amplitude of the peaks and troughs is reduced. The standing‑wave ratio (SWR) for this mismatch is 1.333, calculated as the ratio of the larger to the smaller impedance.
Weak resonances on a mismatched transmission line.
In all these examples, the reflected wave is 100 % of the incident wave at the line’s end, but the voltage and current amplitudes vary along the line depending on the frequency.
Standing Wave Ratio (SWR)
SWR quantifies the severity of standing waves. It is defined as the ratio of the maximum amplitude (antinode) to the minimum amplitude (node) of voltage or current along the line.
For an open or shorted line, SWR is infinite because the minimum amplitude is zero. For a perfectly matched line, SWR is 1 because the voltage and current are uniform along the line.
High SWR values not only indicate inefficient power transfer but can also stress the line’s insulation and conductors, potentially causing breakdown or overheating. Conversely, antennas intentionally operate at high SWR to maximize radiation.
Practical Implications
In RF systems, engineers strive for low SWR to ensure maximum power delivery and to minimize unintended radiation. However, certain applications—such as impedance matching transformers or certain antenna designs—exploit standing waves to achieve desired performance.
Review
- Standing waves are stationary voltage and current patterns formed by the interference of incident and reflected waves on a transmission line.
- A node is a point of minimum amplitude; an antinode is a point of maximum amplitude.
- Standing waves arise only when the line’s termination impedance does not match its characteristic impedance.
- Resonance occurs when the line length corresponds to a quarter‑wavelength or its integer multiples.
- Harmonics are integer multiples of the fundamental resonant frequency.
- The standing wave ratio (SWR) is the ratio of maximum to minimum amplitude; it equals the greater of Zload or Z0 divided by the lesser. A matched line has SWR = 1.
- Excessive standing‑wave amplitudes can damage transmission lines by over‑volting insulation or over‑heating conductors.
Industrial Technology
- Demonstrating Sound Cancellation with Speaker Phase Reversal
- Decoding Numbers and Symbols in Electronics
- Analyzing a Parallel R‑L‑C Circuit: Impedance, Current, and SPICE Simulation
- Analyzing Series-Parallel RC and RL Circuits with Complex Impedance
- Comprehensive Summary of Resistors, Inductors, and Capacitors in AC Circuits
- Series LC Resonance: Zero Impedance and Voltage Peaks Explained
- Graphene Metasurface for Dual-Function Generation and Steering of Vortex Waves
- Unlocking Supply Chain Synergy: Overcoming Obstacles for Resilient Growth
- Six Key Trends Bridging Manufacturers to the Smart Factory Future
- Harnessing Automation in Manufacturing: Boost Efficiency & Cut Labor Costs