


Build a Smart Voltmeter with Arduino & Smartphone – Easy DIY Project
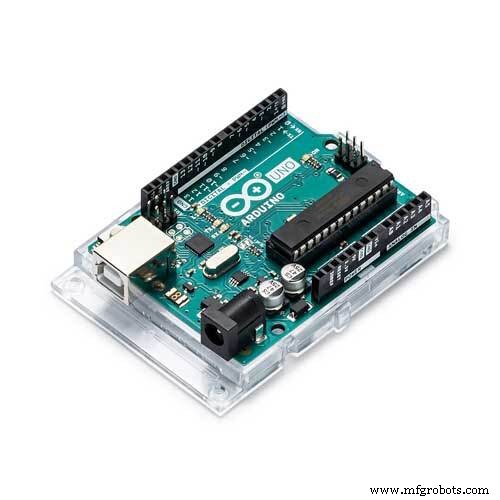
Components and supplies
 |
| × | 1 | |||
 |
| × | 1 | |||
 |
| × | 1 | |||
 |
| × | 1 | |||
| × | 1 |
About this project
DemonstrationIf you are new to Arduino, you can get started with Arduino Tutorials for newbie.
How it worksWe can use Arduino analog input pin to measure voltage. However, the maximum measurable voltage is 5V.
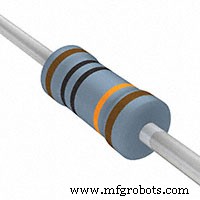
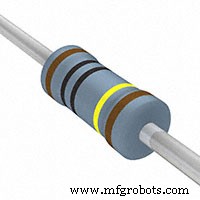
To increase the measurable voltage, we need to use a voltage divisor
InTheory
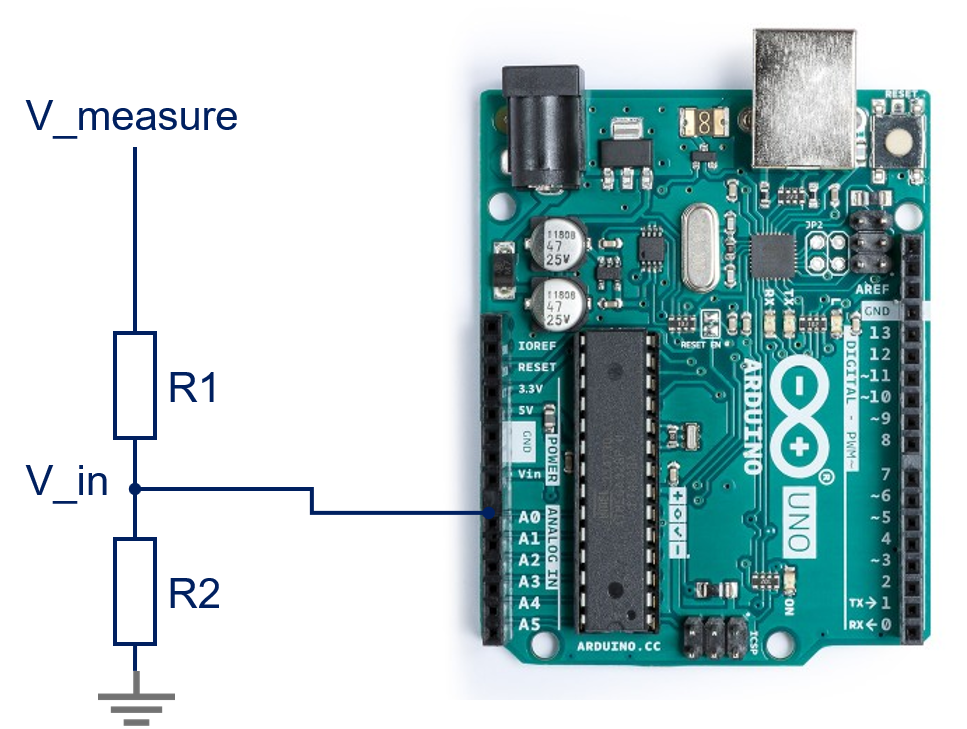
We has:
V_measure = (R1 + R2) / R2 * V_in
ratio = (R1 + R2) / R2
=> V_measure = ratio * V_in
If we choose R1 = 10 * R2, we have:
V_measure = 11 * V_in
Since the maximum of the allowable V_in is 5V => The maximum of the measurable voltage is 55V
To limit the current run though Arduino's pin, which may cause damage to Arduino, we need to choose resistor value as big as possible.
I choose R1 = 1 Mohm, R2 = 100Kohm
In Practice
There is some problems in practice
- Value of R1 and R2 has errors. The errors cause the error of V_measure
- Power source of of Arduino may be unstable. It makes the V_REF of analog input is unstable. Therefore, it causes the error in calculation of V_in. => it causes error in calculation of V_measure
These problems are solved on the Calibration part
Calibration1. Measure the real value of (R1 + R2) / R2
This need to be done only one time to get the ratio
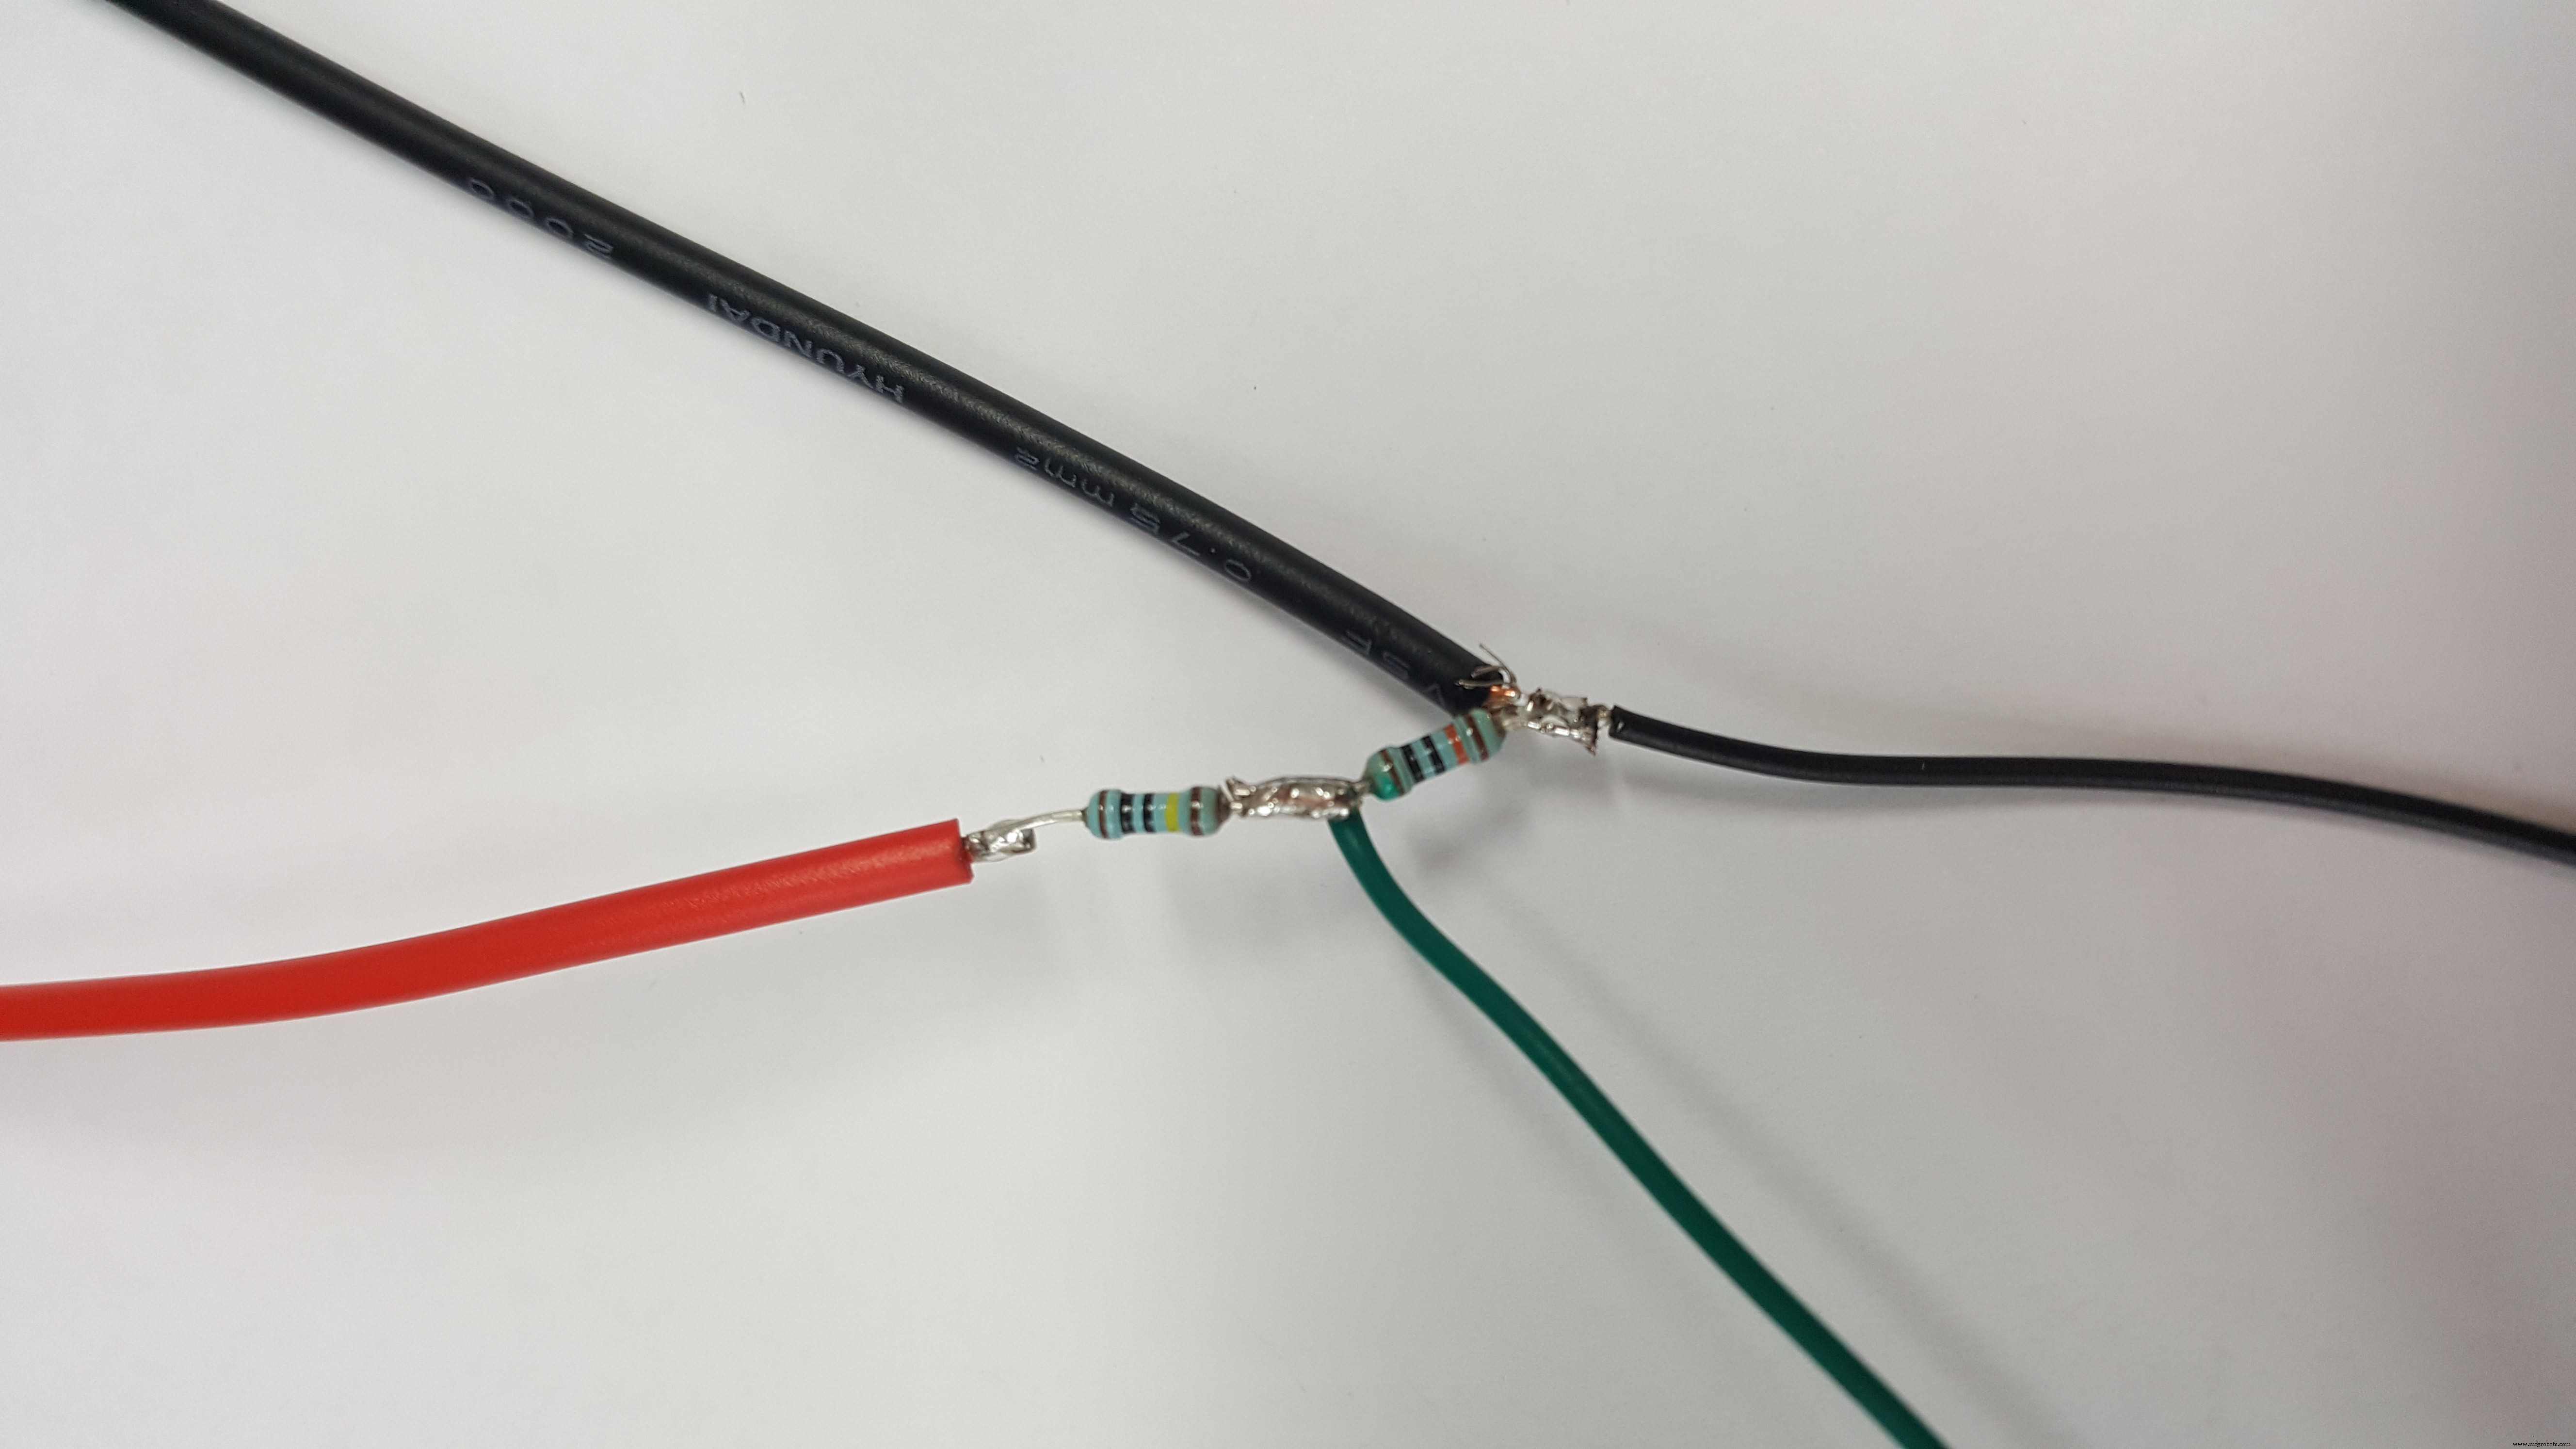
Wiring as bellow image:
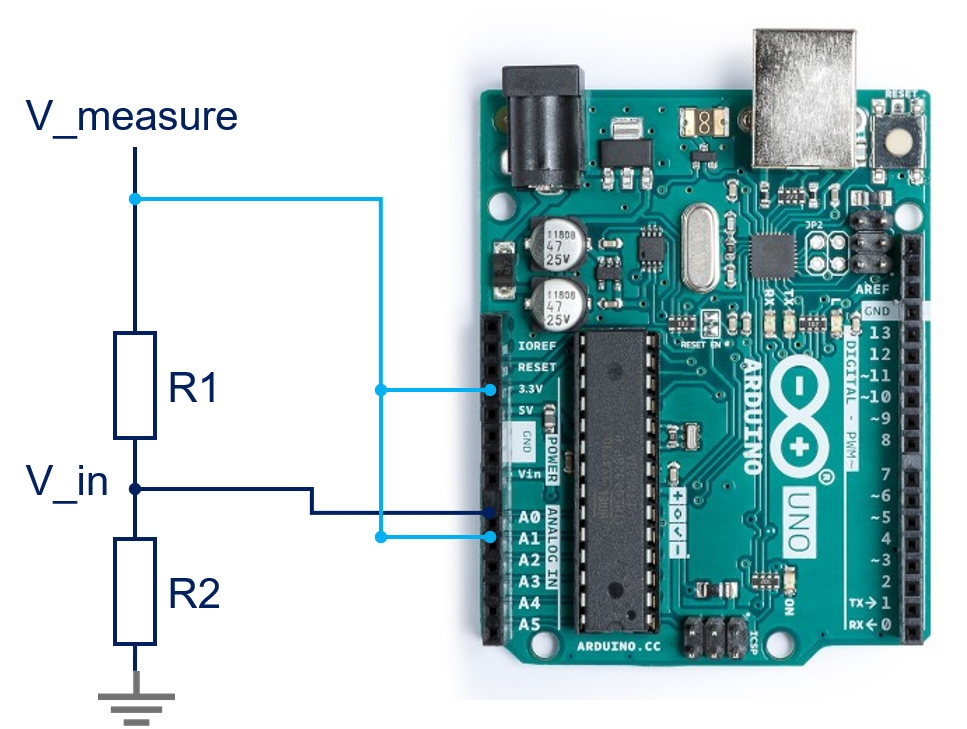
ratio = (R1 + R2) / R2 = V_measure / V_in = A1_read_value / A0_read_value
ratio = A1_read_value / A0_read_value
Code for this calibration => see ResisterCalibration.ino in code part
2. Instability of power supply
Instability of power supply causes instability in voltage reference of analog pin. It causes the wrong measure in voltage calculation.
To solve it, we need to measure the voltage reference frequently.
How to measure the voltage reference?
Connect 3.3V to pin A1
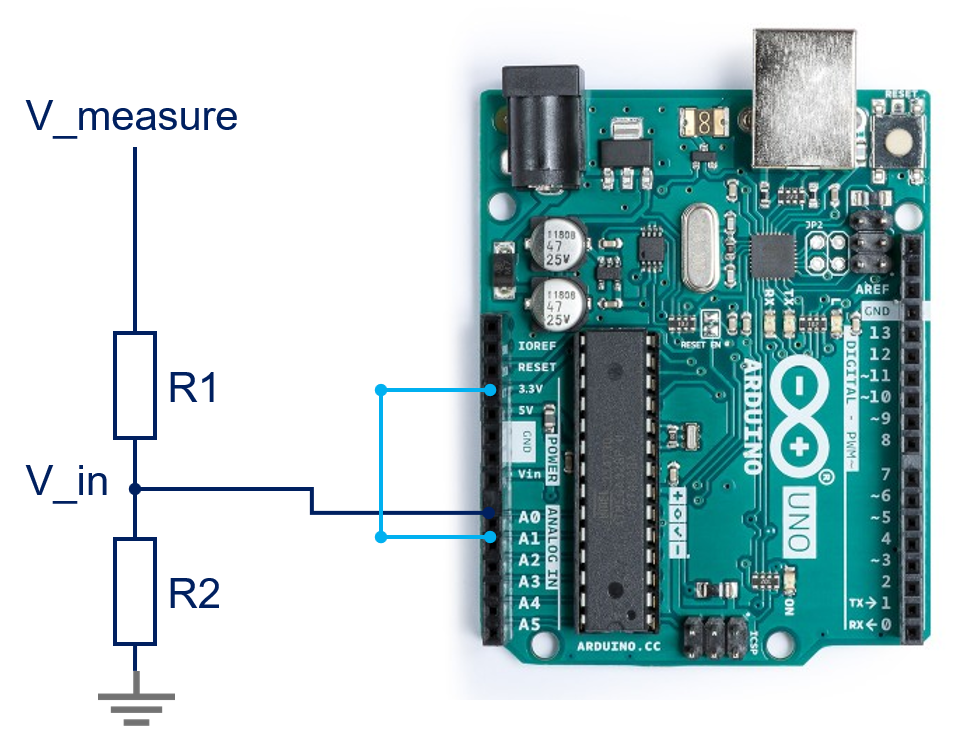
The voltage reference is measured indirectly based on value in A1:
V_reference= 1023 * 3.3 / A1_value
How to calculate the V_measure:
V_in = mapFloat(A0_value, 0, 1023, 0, V_reference);V_measure = ratio * V_in;
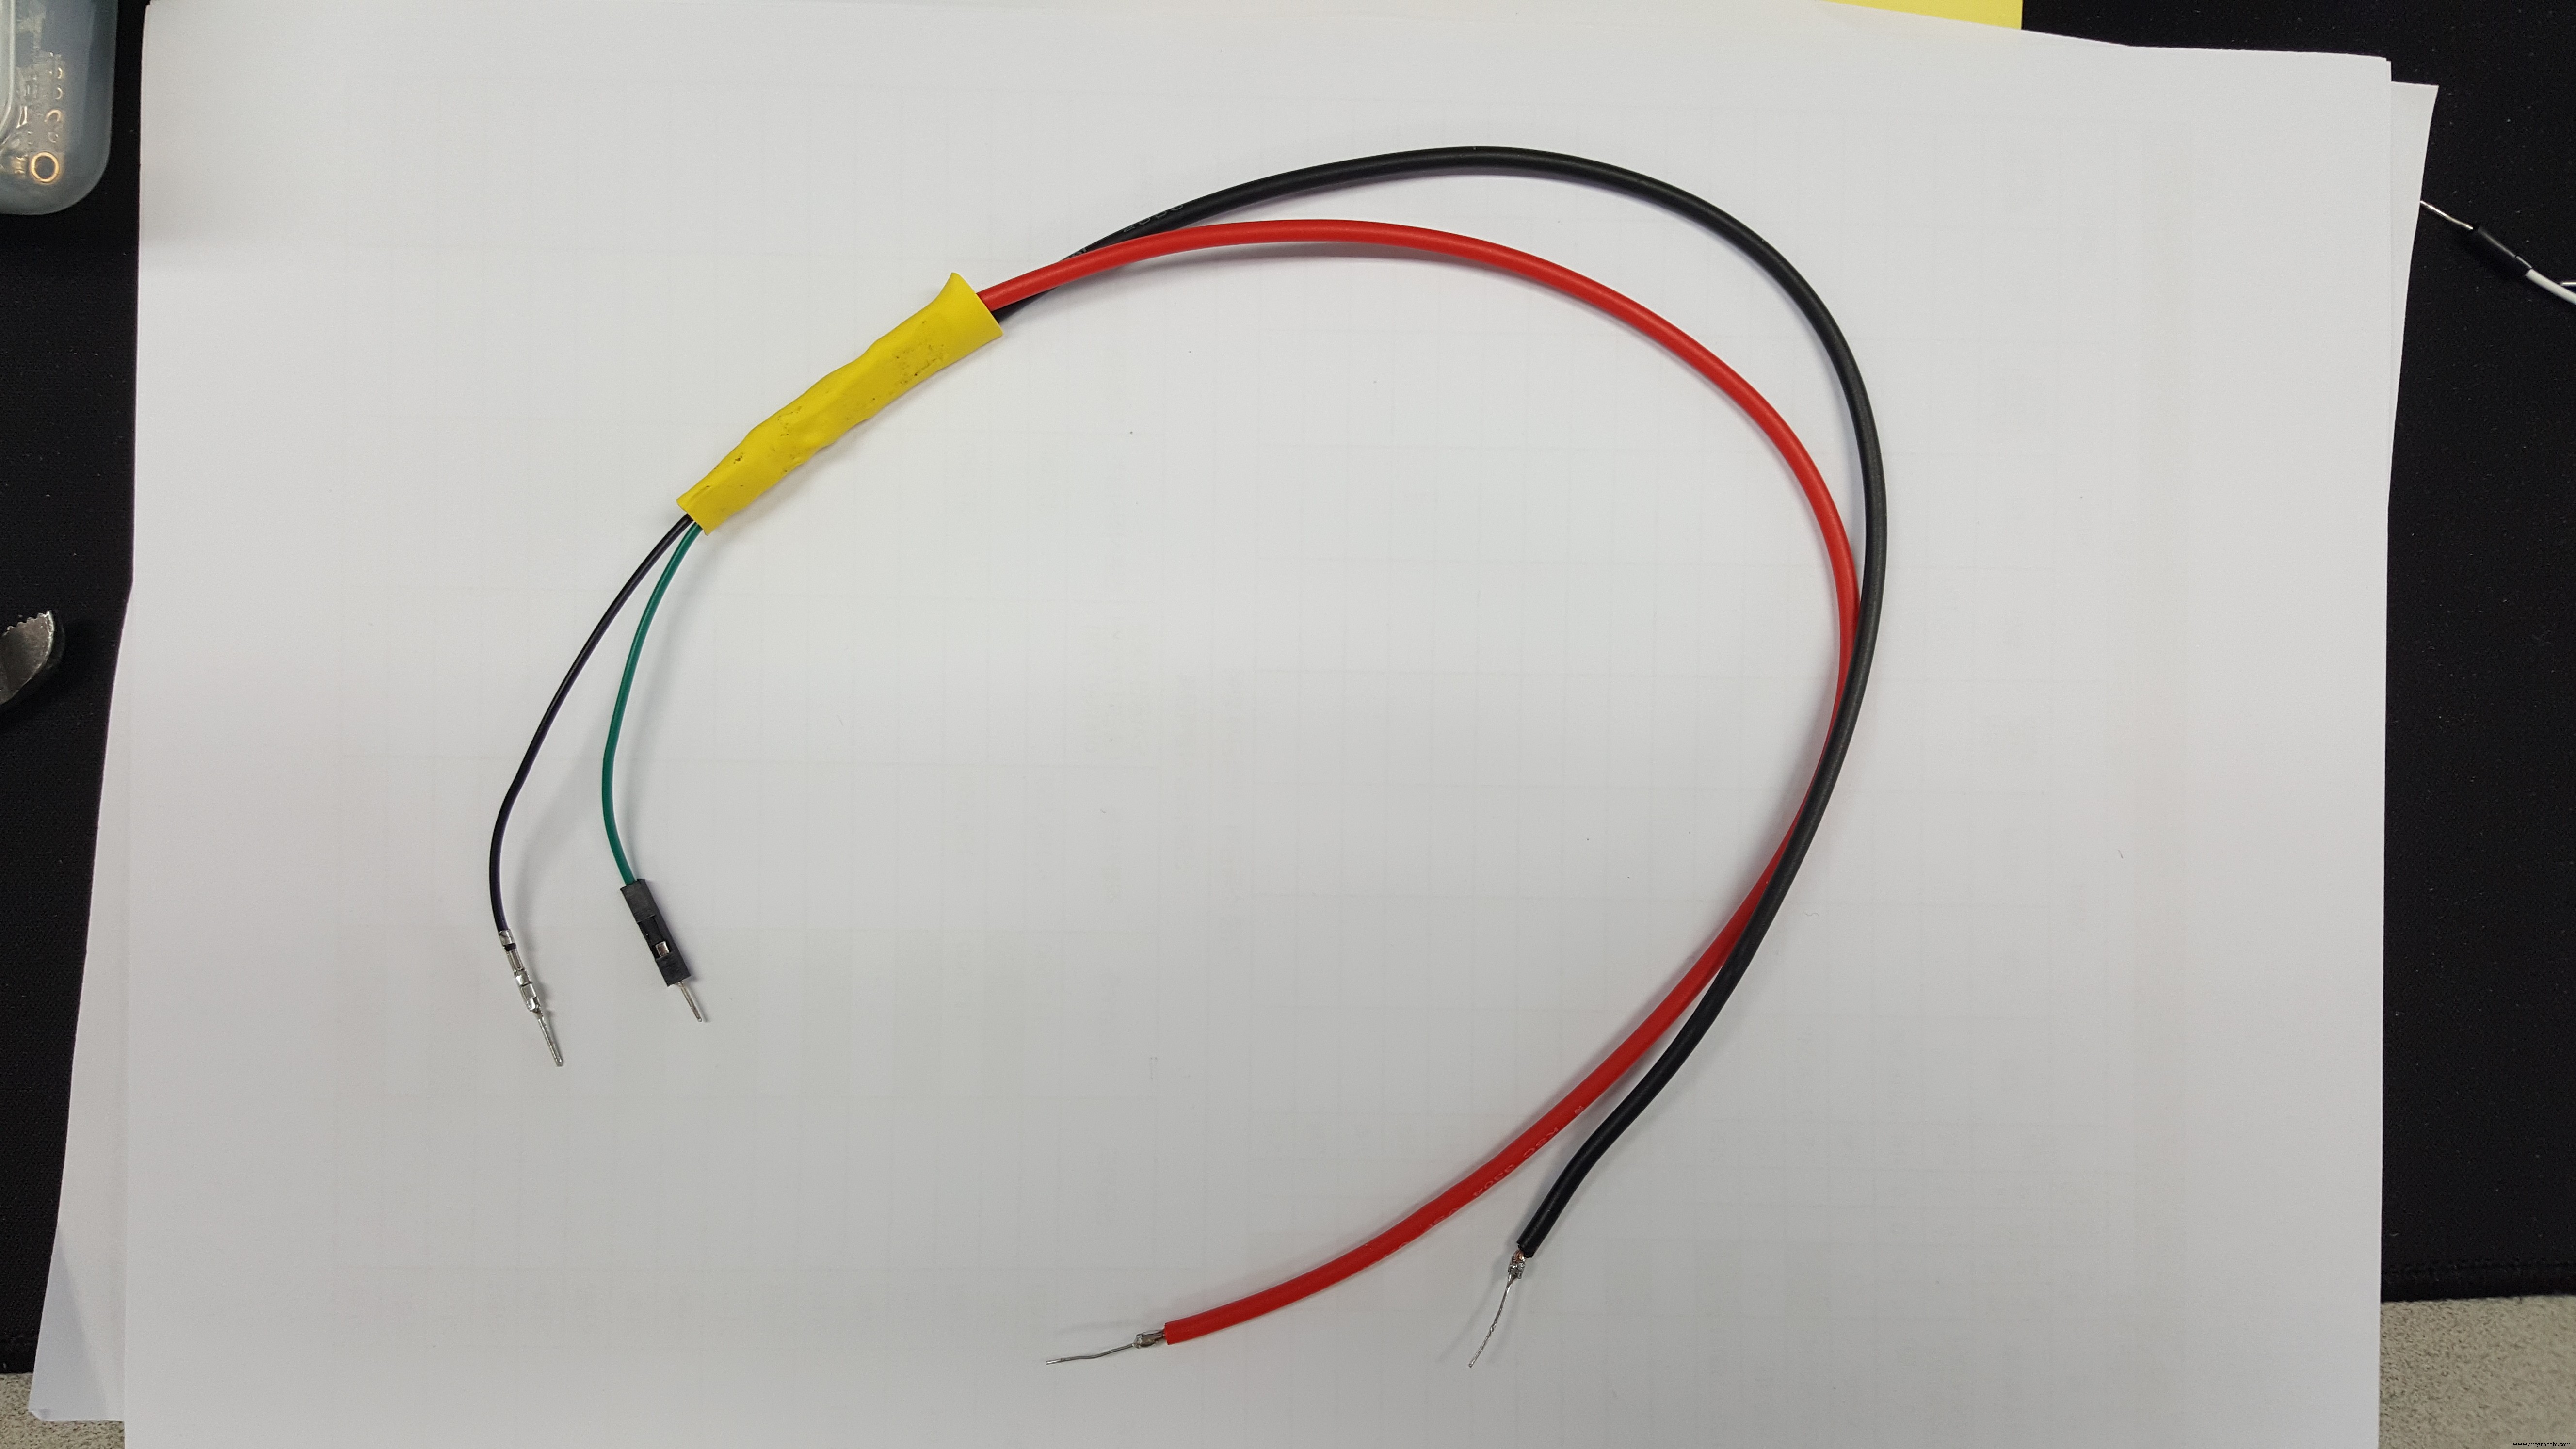
Main wiring:
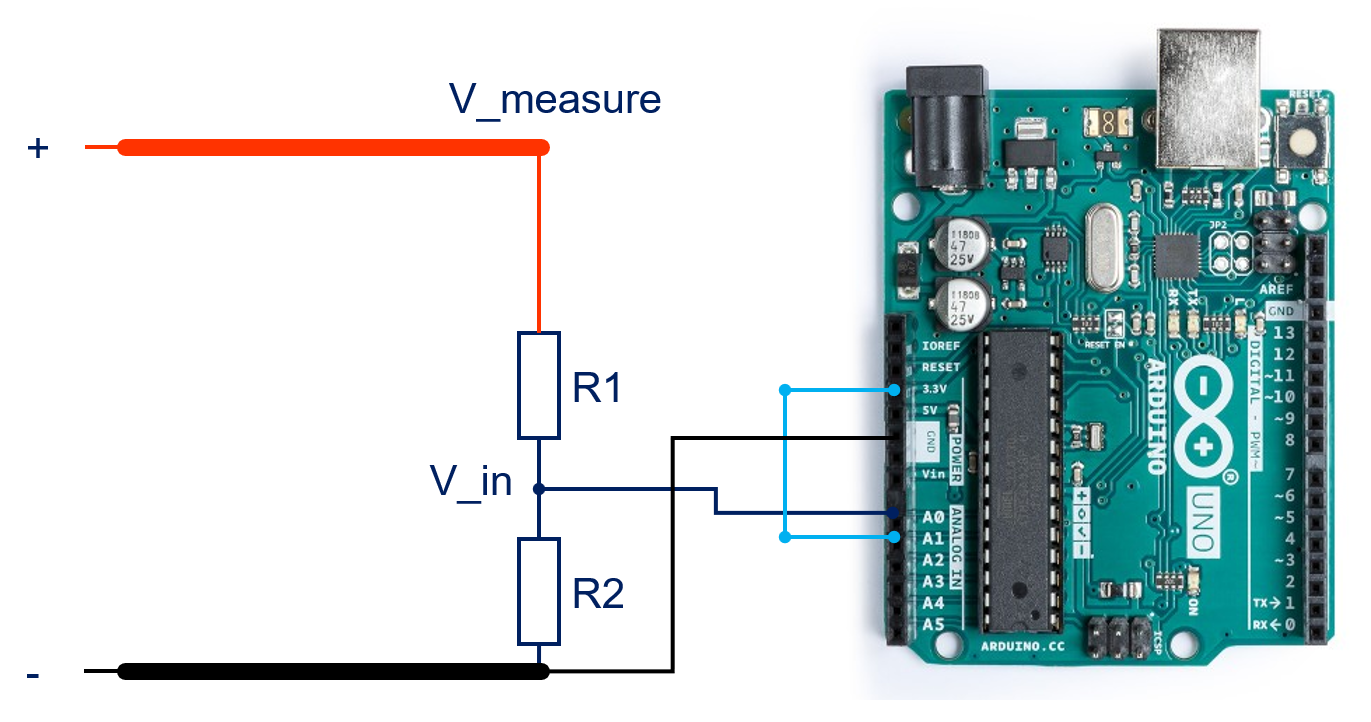
- Wiring as "resistor calibration wiring" circuit
- Upload ResistorCalibration.ino
- Open Serial Plotter
- Copy the ratio value
- Replace this value in line 5 of Voltmeter.ino
- Re-wiring as "main wiring"
- Upload Voltmeter.ino
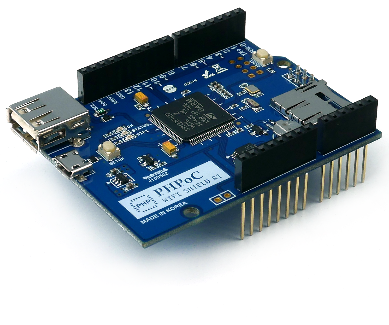
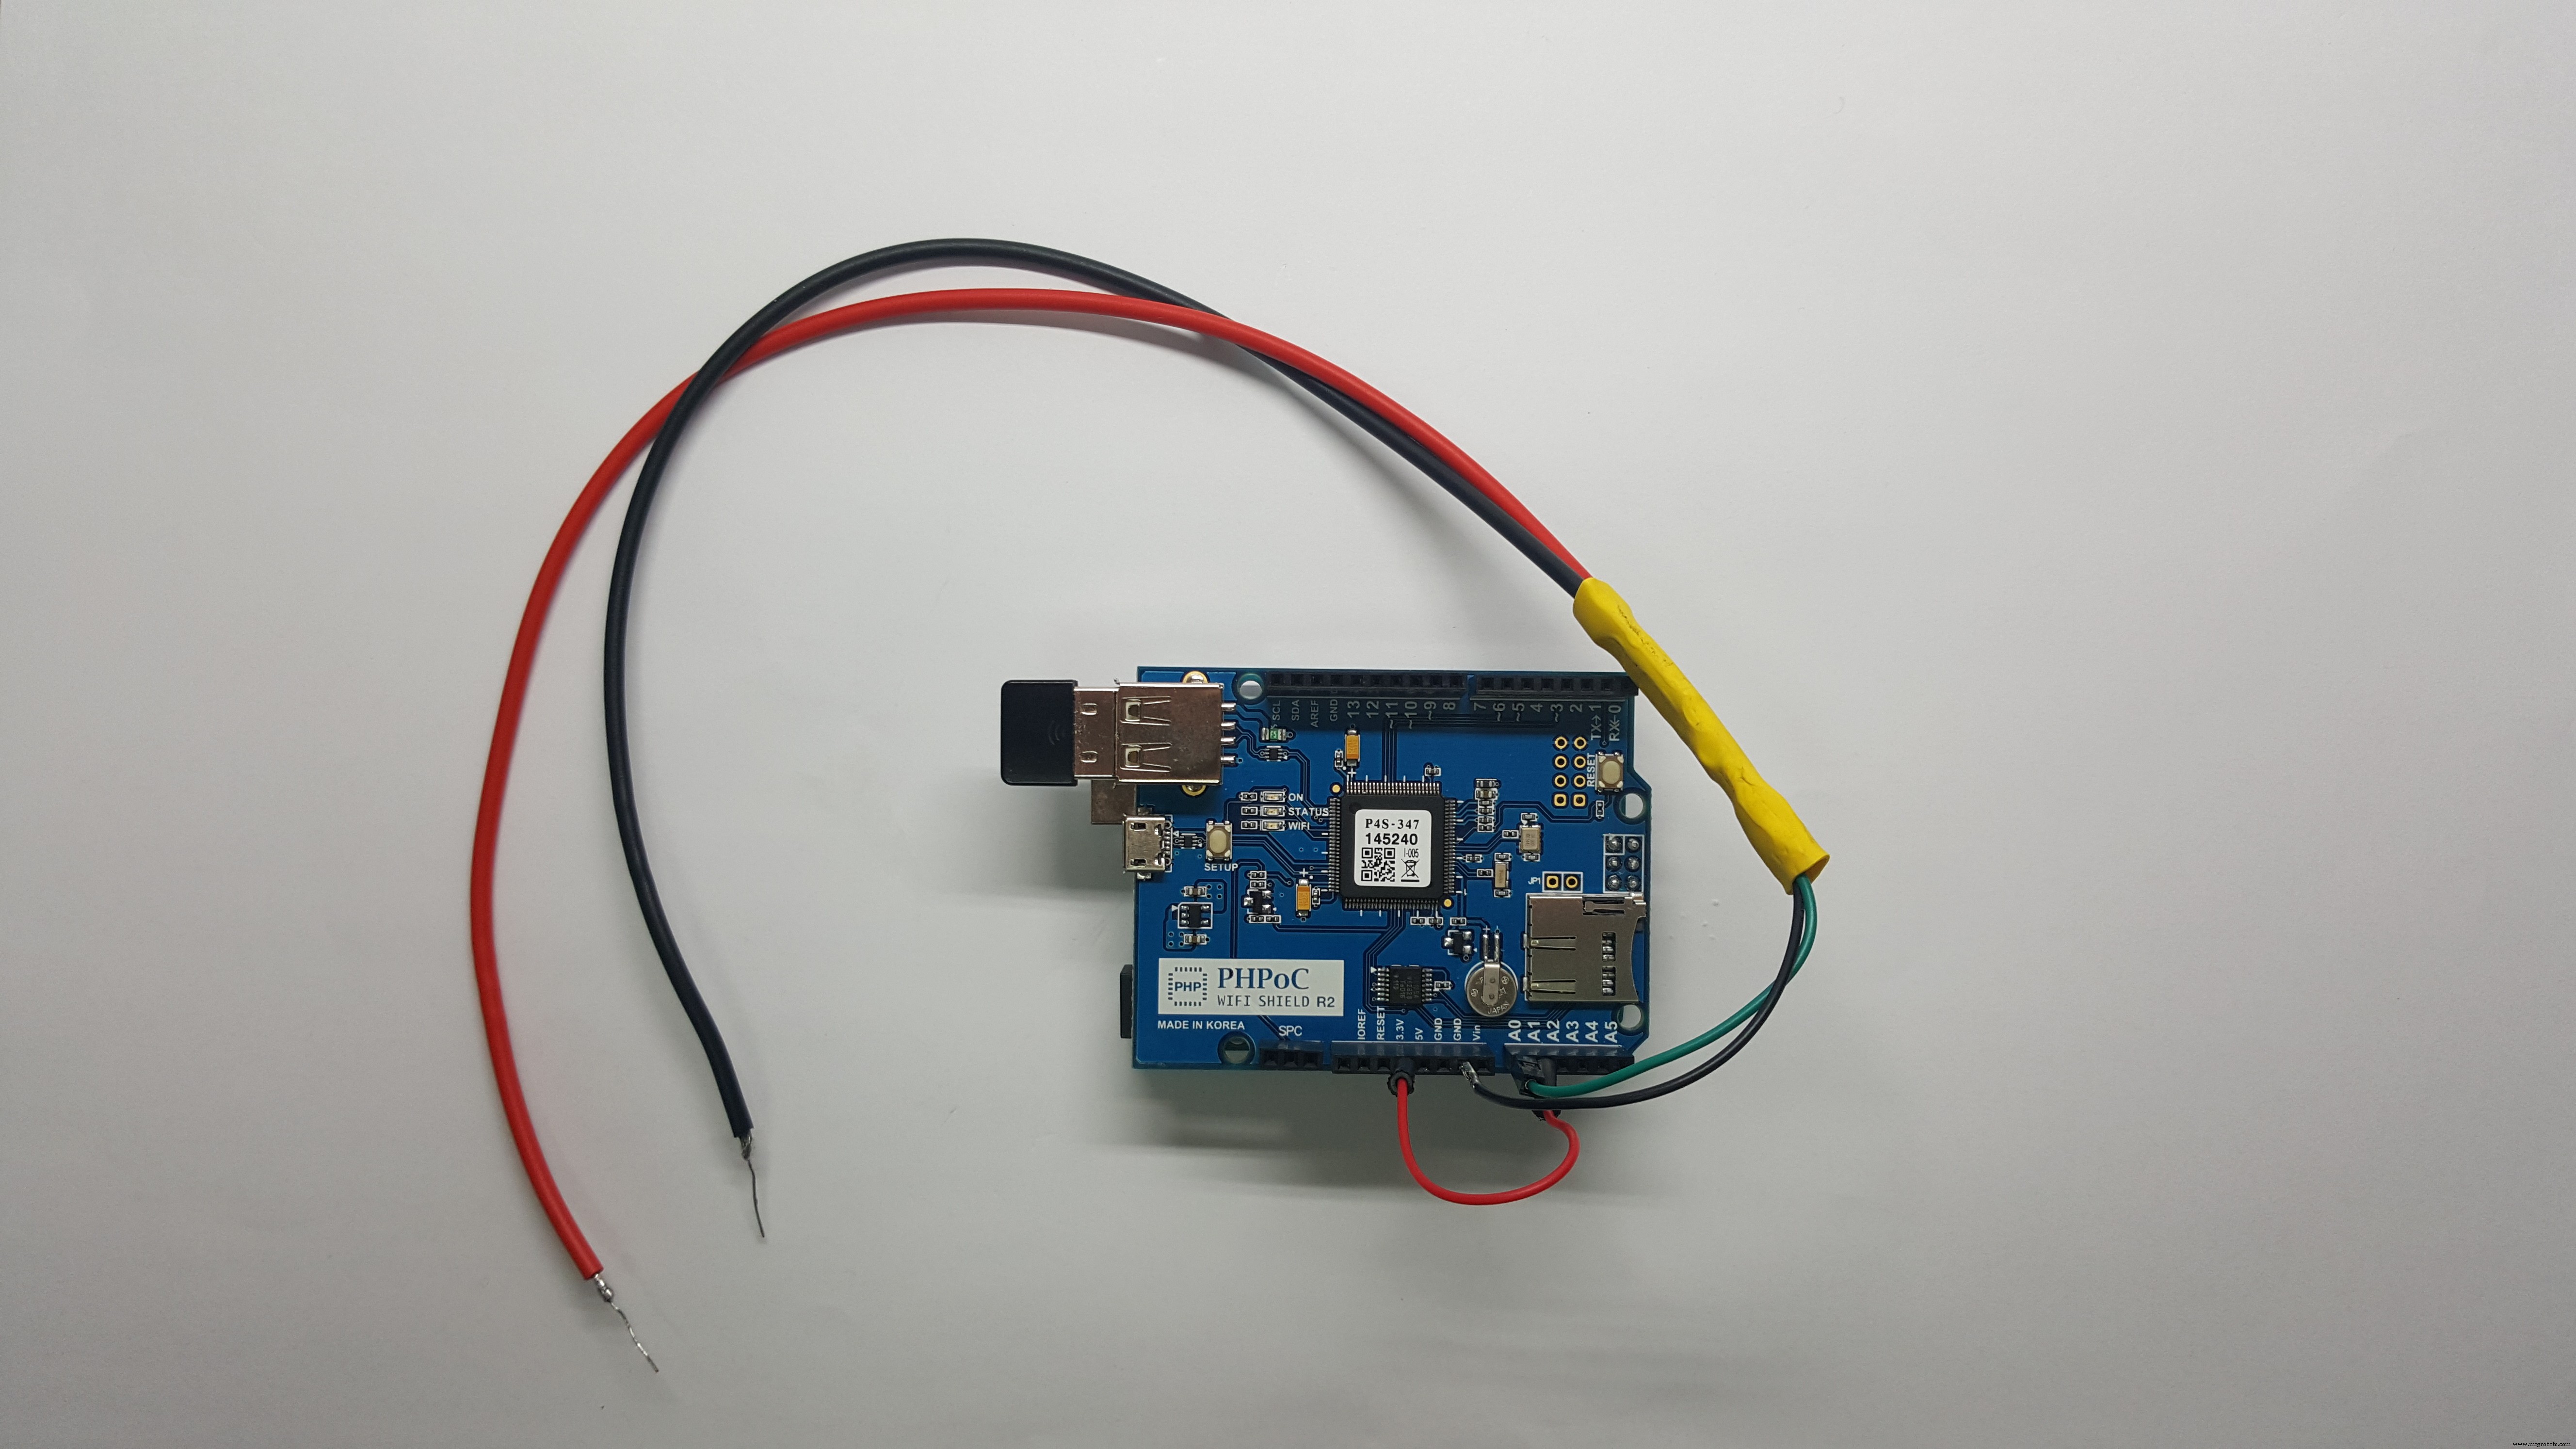
- Upload Web User Interface (voltmeter.php and voltmeter_body.jpg) to PHPoC Shield
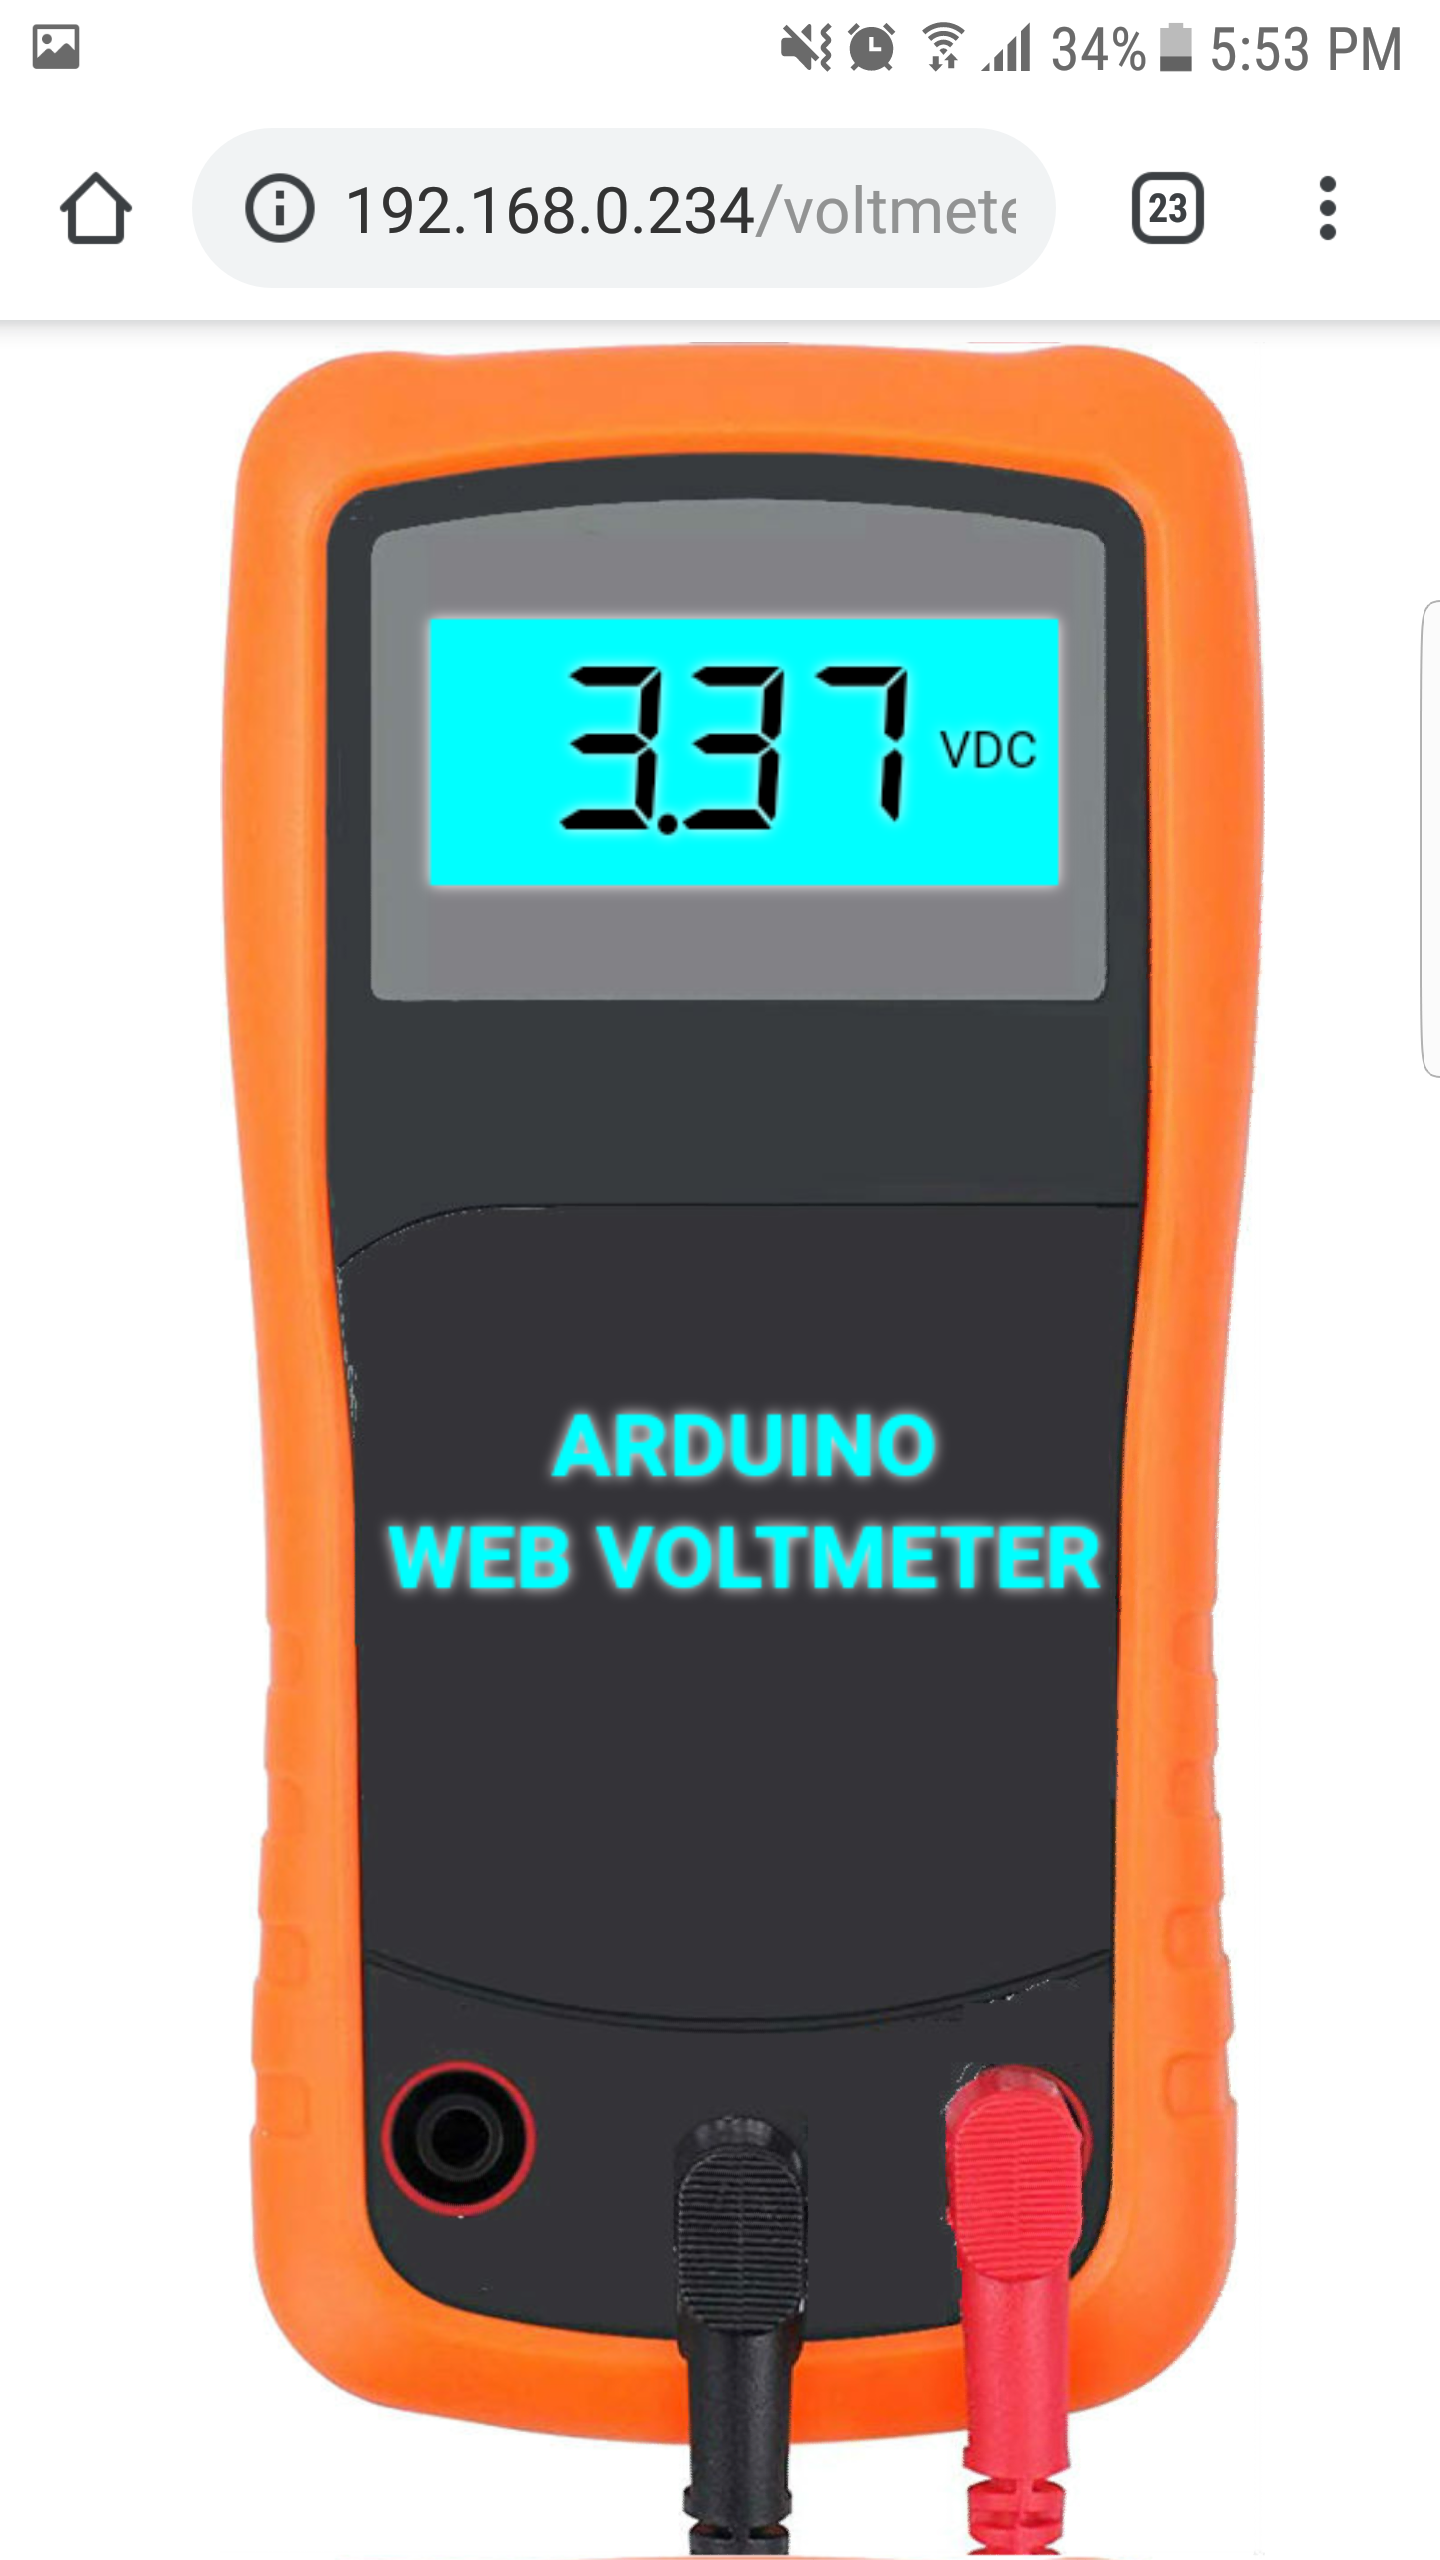
- Access Web page http://phpoc_shield_ip_address/voltmeter.php to see the voltage.
You can view the voltage on smart phone as follows:
Wiring Tips:
See The Best Arduino Kit for Beginners
Code
- ResistorCalibration.ino
- Voltmeter.ino
- voltmeter.php
ResistorCalibration.inoArduino
- Wiring as described in Calibration part- Run this code once time
- Open Serial Plotter
- Copy the ratio value
- Replace this value in line 5 of Voltmeter.ino
double ratio;

int analogReadAverage(int pin, int read_time)
{
	unsigned long read_value = 0;
	// read the analog in value read_time times:
	for(int i = 0; i < read_time; i++) {
		read_value += analogRead(pin);
		delay(2);
	}

	// Get average
	read_value /= read_time;

	return read_value;
}

double resistorCalibration()
{
	double _ratio;
	double A0_read_value;
	double A1_read_value;

	A0_read_value = analogReadAverage(A0, 20);
	A1_read_value = analogReadAverage(A1, 20);

	_ratio = A1_read_value / A0_read_value;

	return _ratio;
}

void setup() {
	// initialize serial communications at 9600 bps:
	Serial.begin(9600);
}

void loop() {
	ratio = resistorCalibration();

	Serial.print("ratio:");
	Serial.println(ratio);
	delay(200);
}
Voltmeter.inoArduino
This is main code. Before uploading this code, we need to :- upload ResistorCalibration.ino
- open Serial Monitor
- copy the ratio value and replace value in line 5 of this code
double V_measure;
double V_in;
double V_reference;

double ratio = 11.59;

double mapFloat(double x, double in_min, double in_max, double out_min, double out_max) {
  return (x - in_min) * (out_max - out_min) / (in_max - in_min) + out_min;
}

int analogReadAverage(int pin, int read_time)
{
	unsigned long read_value = 0;

	for(int i = 0; i < read_time; i++) {
		read_value += analogRead(pin);
		delay(2);
	}

	// get average
	read_value /= read_time;

	return read_value;
}


double getVoltageReference()
{
	double A1_value = analogReadAverage(A1, 20); // A1 is connected to 3.3v
	double V_REF = 1023 * 3.3 / A1_value;

	return V_REF;
}

void setup() {
  Serial.begin(9600);
}

void loop() {
  // update voltage reference
  V_reference = getVoltageReference();

  double A0_value = analogReadAverage(A0, 20);

  // map it to the range of the analog out:
  V_in = mapFloat(A0_value, 0, 1023, 0, V_reference);
  V_measure = ratio * V_in;

  // print the results to the Serial Monitor:
  Serial.println(V_measure);

  delay(200);
}
voltmeter.phpPHP
This file is Web User Interface. It need to be uploaded to PHPoC Shield along with background image voltmeter_body.jpg<!DOCTYPE html>
<html>
<head>
<title>PHPoC Shield - VOLTMETER</title>
<meta name="viewport" content="width=device-width, initial-scale=0.7">
<link rel="stylesheet" media="screen" href="https://fontlibrary.org/face/segment7" type="text/css"/>
<style>
html {height: 100%;}
body {width: 100%; height: 100%;; text-align: center;}
.container {width: 100%; min-height: 99%; max-height: 100%;}
canvas {
background: url(voltmeter_body.jpg);
background-size:contain;
font-family: 'Segment7Standard';
font-weight: bold;
font-style: italic;
}
</style>
<script>
var COLOR_LCD_TEXT = "#000000";
var COLOR_LCD_BGR = "#00FFFF";
var IMG_WIDTH = 583;
var IMG_HEIGHT = 1235;
var METER_WIDTH, METER_HEIGHT;
var ws;
var canvas;
var ctx;
var buffer = "";
var voltage = 0;
function init()
{
canvas = document.getElementById("graph");
ctx = canvas.getContext("2d");
canvas_resize();
update_view(voltage);
var ws_host_addr = "<?php echo _SERVER("HTTP_HOST")?>";
if((navigator.platform.indexOf("Win") != -1) && (ws_host_addr.charAt(0) == "["))
{
// network resource identifier to UNC path name conversion
ws_host_addr = ws_host_addr.replace(/[\[\]]/g, '');
ws_host_addr = ws_host_addr.replace(/:/g, "-");
ws_host_addr += ".ipv6-literal.net";
}
ws = new WebSocket("ws://" + ws_host_addr + "/serial_monitor", "uint8.phpoc");
ws.onopen = ws_onopen;
ws.onclose = ws_onclose;
ws.onmessage = ws_onmessage;
ws.binaryType = "arraybuffer";
}
function ws_onopen()
{
}
function ws_onclose()
{
alert("CANNOT connect to Arduino!");
ws.onopen = null;
ws.onclose = null;
ws.onmessage = null;
ws = null;
}
function ws_onmessage(e_msg)
{
e_msg = e_msg || window.event; // MessageEvent
var u8view = new Uint8Array(e_msg.data);
buffer += String.fromCharCode.apply(null, u8view);
buffer = buffer.replace(/\r\n/g, "\n");
buffer = buffer.replace(/\r/g, "\n");
while(buffer.indexOf("\n") == 0)
buffer = buffer.substr(1);
if(buffer.indexOf("\n") <= 0)
return;
var pos = buffer.lastIndexOf("\n");
var str = buffer.substr(0, pos);
var arr = str.split("\n");
buffer = buffer.substr(pos + 1);
if(arr.length)
{
voltage = parseFloat(arr[arr.length - 1]);
update_view(voltage);
}
}
function update_view(voltage)
{
ctx.clearRect(0, 0, METER_WIDTH, METER_HEIGHT);
var top = METER_HEIGHT * 0.125; // 12.5%
var left = METER_WIDTH * 0.2; // 2%
var width = METER_WIDTH * 0.6; // 6%
var height = METER_HEIGHT * 0.12; // 12%
ctx.fillStyle = COLOR_LCD_BGR;
ctx.rect(left, top, width, height);
ctx.fill();
ctx.font = "italic 75px Segment7Standard";
ctx.textBaseline = "middle";
ctx.textAlign = "end";
ctx.fillStyle = COLOR_LCD_TEXT;
ctx.fillText(voltage.toFixed(2), left + width - 50, top + height / 1.8);
ctx.font = "18px Arial";
ctx.textBaseline = "middle";
ctx.textAlign = "center";
ctx.fillText("VDC", left + width - 25, top + height / 2);
ctx.font = "bold 32px Arial";
ctx.shadowBlur = 5;
ctx.shadowColor = "white";
ctx.fillStyle = "#00FFFF";
ctx.fillText("ARDUINO", METER_WIDTH / 2, METER_HEIGHT * 0.5);
ctx.fillText("WEB VOLTMETER", METER_WIDTH / 2, METER_HEIGHT * 0.55);
}
function canvas_resize()
{
canvas.width = 0; // to avoid wrong screen size
canvas.height = 0;
var container = document.getElementById("container");
var height = container.clientHeight;
var ratio = height / IMG_HEIGHT;
var width = ratio * IMG_WIDTH;
METER_WIDTH = width;
METER_HEIGHT = height;
canvas.width = METER_WIDTH;
canvas.height = METER_HEIGHT;
update_view(voltage);
}
window.onload = init;
</script>
</head>
<body onresize="canvas_resize()">
<div class="container" id="container">
<canvas id="graph"></canvas>
</div>
</body>
</html>
Schematics
It need to be uploaded to PHPoC Shield
Manufacturing process
- Build a DIY Photoshop Control Console with Arduino Nano RP2040
- Build a DIY Voltmeter with Arduino and Nokia 5110 Display – Step‑by‑Step Guide
- Build a Compact FM Radio with Arduino Nano and RDA8057M
- Accurate Rain Forecasting: Build an Arduino-Powered System with Python & Keras
- Smartphone G‑Sensor Controlled Robot Car with Arduino and Bluetooth
- Building an IoT Device with ESP8266‑01 and Arduino Nano: A Complete Guide
- Gesture Recognition with ESP32 and Arduino 101 Accelerometer – Easy DIY Tutorial
- Build a Wire‑Free Arduino Robot Arm, Controlled from Your Smartphone
- DIY Motorized Camera Slider with Pan & Tilt – Arduino-Controlled Project
- Build a Reliable Arduino RC Receiver for Models & Projects