


Quartz Crystal Frequency Deviations: Tolerance, Stability & Aging Explained
Understanding Quartz Crystal Frequency Deviations
Accurate timing is essential for every electronic system, and quartz crystals are the industry’s go‑to solution. Their piezoelectric nature turns mechanical strain into voltage and vice versa, providing a highly reliable, low‑cost frequency reference. However, several metrics determine how well a crystal performs in real‑world conditions: frequency tolerance, frequency stability, and aging.
Frequency Tolerance
Frequency tolerance defines the maximum deviation from the nominal frequency at 25 °C, expressed in parts per million (ppm). For instance, a 32 768 Hz crystal with a ±20 ppm tolerance can oscillate anywhere between 32 767.34464 Hz and 32 768.65536 Hz at room temperature. This variation stems from normal manufacturing and assembly tolerances. Common tolerance grades are ±20 ppm, ±50 ppm, and ±100 ppm. While custom ±5 ppm crystals exist, they come at a premium.
Frequency Stability
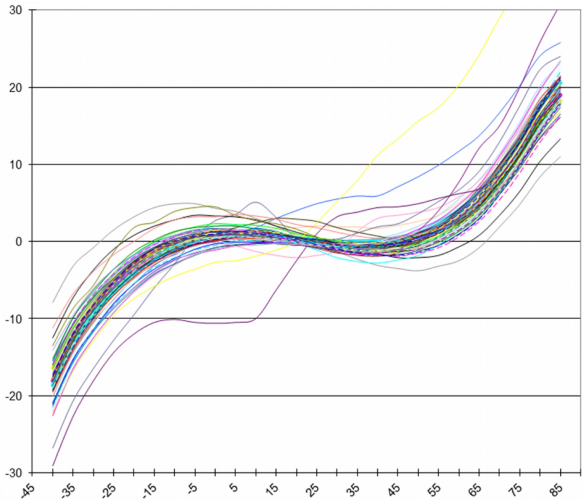
Unlike tolerance, stability describes how the crystal’s frequency shifts across its operating temperature range. Figure 1 illustrates the temperature response of a typical AT‑cut crystal, showing a ±12 ppm swing from –40 °C to +85 °C. The 25 °C point is the reference, where the deviation is zero.
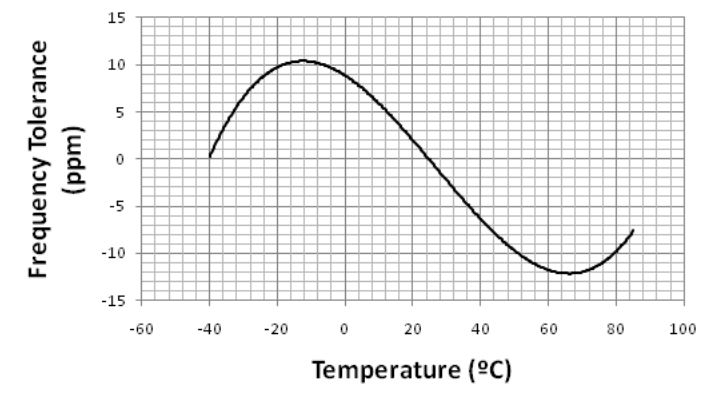
Temperature changes cause the crystal lattice to expand or contract, altering its resonant frequency. When designing for extreme environments—think hot kitchens or Arctic conditions—ignoring stability can push a system outside its timing budget.
Cut Type Matters
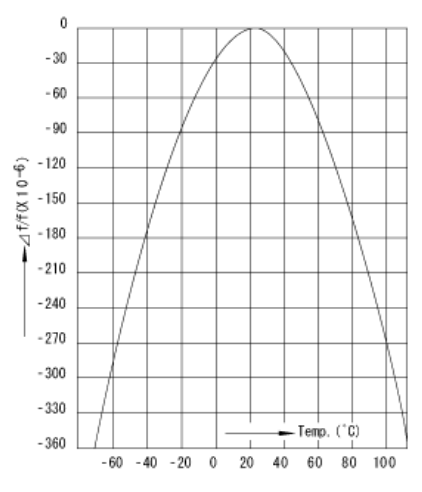
The crystal cut—defined by the angle at which quartz is sliced—drastically influences its temperature behavior. AT‑cut crystals produce a cubic curve (Figure 1), whereas BT‑cut crystals follow a parabolic path (Figure 2).
AT‑cut crystals tend to maintain smaller frequency deviations over the temperature range and often return to nominal values when averaged over time, making them ideal for time‑keeping. Other cuts—XY, SC, IT—offer trade‑offs in temperature performance, stress sensitivity, size, impedance, aging, and cost.
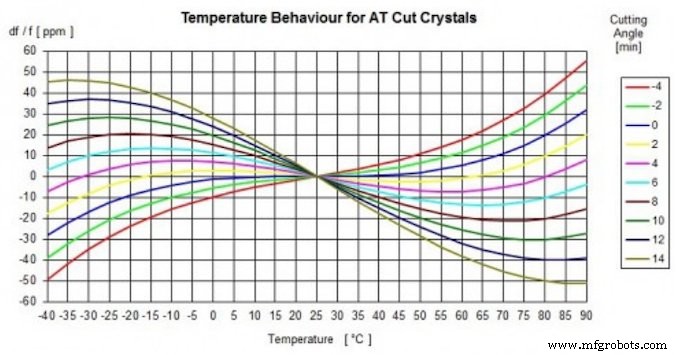
Typical stability grades are ±20 ppm, ±50 ppm, and ±100 ppm over a specified range. Custom crystals can achieve ±10 ppm from –40 °C to +85 °C, but the manufacturing complexity—and price—escalate sharply, as shown in Figure 3.
Drive Level and Overdrive Effects
Each crystal has a maximum safe drive level, typically in the microwatt to milliwatt range. Exceeding this level can degrade stability dramatically. Figure 4 shows a crystal driven at 10 µW: the temperature response remains smooth.
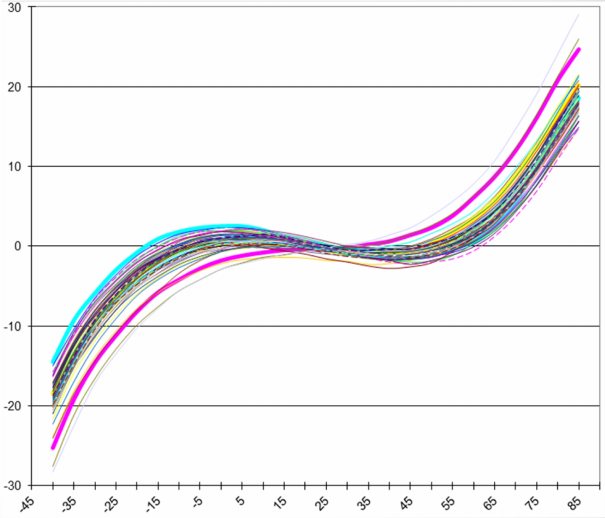
When the drive level is raised to 500 µW, the response becomes erratic, as illustrated in Figure 5.
Aging Mechanisms
Crystals age, much like any mechanical component. Common aging causes include:
- Mechanical stress relaxation from PCB mounting.
- Surface contamination (dust or debris) altering mass.
- Drive‑level induced changes.
Lower drive levels mitigate aging, and the rate of aging slows over time. An overdriven crystal may age in a month as fast as a properly driven crystal in a year. Figure 6 demonstrates a typical aging curve.
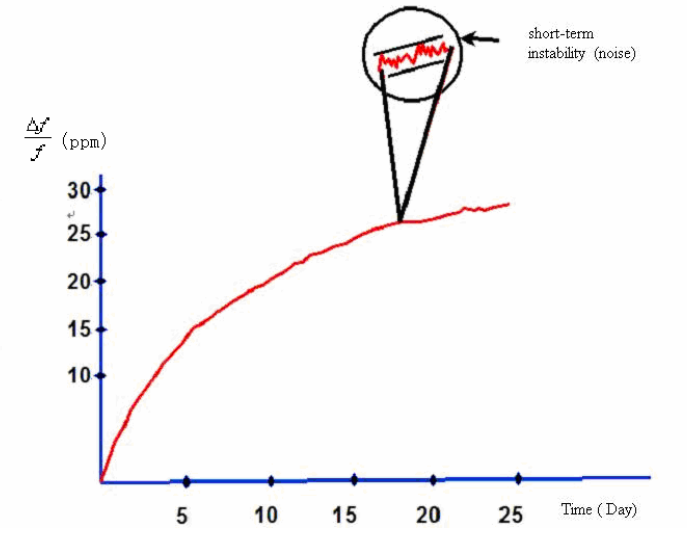
Aging curves can be non‑monotonic when multiple mechanisms interact, but most aging occurs within the first year. A 5‑year‑old crystal will exhibit far less frequency drift than a 1‑year‑old one.
Total Frequency Error
The aggregate error is the sum of tolerance, stability, and aging. Figure 7 shows how these components combine into a single “total stability” metric.
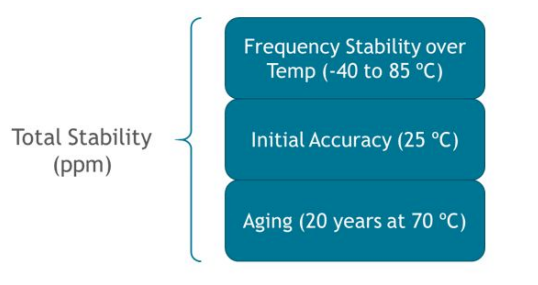
For example, a crystal with ±10 ppm tolerance, ±20 ppm stability from –40 °C to +85 °C, and ±3 ppm aging in the first year has a total error of ±33 ppm. This figure informs whether the crystal meets an application’s timing requirement.
Consider RF standards: 802.15.4 allows a 40 ppm carrier frequency deviation, whereas Bluetooth Low Energy (BLE) demands only 20 ppm. A crystal with ±30 ppm total error satisfies 802.15.4 but not BLE. The next article will explore additional parameters that influence crystal reliability.
Explore more of my work here.
Internet of Things Technology
- Valence Electrons, Crystal Structures, and Their Role in Conductivity
- Measuring Frequency and Phase in AC Power Systems
- Assessing Precision of a Current‑Pump Circuit Across Resistor Tolerances and Automotive Temperature Ranges
- Quartz Crystal Frequency Deviations: Tolerance, Stability & Aging Explained
- Frequency Response, Range, and Resolution in Motor Testing: What You Need to Know
- Fault Tolerance: Boosting Reliability, Availability, and Safety in Critical Systems
- Ultra‑Thin, Triple‑Band Metamaterial Absorber with 99.9% Efficiency and Wide‑Angle Stability for Conformal X/Ku Band Applications
- Engineering Tolerances Explained: Definition, Types, and Practical Applications
- Mastering Tolerance in Precision CNC Machining
- Mastering Accuracy, Precision, and Tolerance in 3D Printing