


The Managing System: Measure What Matters in Maintenance
For decades, the debate over how to measure maintenance has simmered—what metrics truly reflect value, and how can they drive continuous improvement? The Society for Maintenance & Reliability Professionals hosts a dedicated committee that tackles these questions, yet the industry still wrestles with choosing between cost per output, equipment uptime, or percent of replacement value. The core of the disagreement lies in a focus on post‑event outcomes rather than actionable, real‑time insights.
Historically, the same accounting and measurement methods have been used for 70‑80 years, but the operating environment has changed dramatically. New performance measures are now essential for three main reasons:
- Traditional metrics no longer align with a world‑class operating environment.
- Customers demand higher standards, and competition forces us to prove we meet those standards.
- Management practices, technology, and reporting tools have evolved, making old measures obsolete.
- Behavior change is now recognized as a critical success factor for any process initiative.
Leading vs. Lagging Indicators
Current measurements are predominantly lagging—outcomes that cannot be altered once the period ends. Yet, today’s manufacturing demands indicators that predict, influence, and shape desired outcomes at every level of the organization. Using leading indicators is akin to monitoring the market before a stock trade; they give us the chance to correct course before the lagging results materialize.
The Managing System
The Managing System is an umbrella process that aligns strategy, goals, and daily actions. It cascades objectives from plant leadership down to the shop floor, integrates both leading and lagging metrics, and provides a framework for accountability. Think of it as a Plan–Do–Check–Act engine that operates at every level, with scheduled reviews, published results, and clear ownership.
Key Process and Outcome Metrics
Below are essential metrics that blend process (leading) and outcome (lagging) indicators. Together, they form a comprehensive view of work‑management health.
- Estimated Backlog in Crew Weeks: Total pending work divided by crew hours per week. Target: 5–7 weeks to balance demand and capacity.
- Percent PM/PdM Compliance: Proportion of preventive maintenance scheduled versus performed. Mature plants aim for 100% compliance.
- Percentage of Reactive Work: Work performed outside the schedule. Lower percentages indicate stronger control.
- Compliance to Schedule: Jobs completed on time versus planned. Target: 90% (allowing up to 10% emergent work).
- Schedule Loading Factor: Percent of available man‑hours scheduled weekly. 90% indicates healthy utilization, 100% suggests minimal emergent work.
- Wrench Time: Time craftsmen spend on actual work. Ideal: 65%; many plants lag at 28–35% due to delays and lack of resources.
Wrench time is measured quarterly via a “day‑in‑the‑life” study, capturing categories such as travel, waiting, and material delays.
Proactive Work Capacity Index (PWCi)
The PWCi blends three key indicators into a single, actionable metric:
PWCi = (Schedule Compliance) × (Schedule Loading) × (Wrench Time)
Using world‑class values (0.90 × 0.90 × 0.65) yields a PWCi of 0.53. Calculated weekly and trended over time, it provides a clear snapshot of overall work‑management effectiveness.
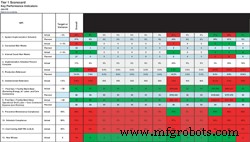
Figure 1 – Typical Scorecard
Scorecard Visualization
A scorecard offers a quick visual of metric status: green for above target, yellow for meeting or slightly below, and red for under performance.
Beyond Numbers: The Importance of Behavioral Metrics
Metrics alone cannot guarantee lasting change. People will always find ways to circumvent pure number‑driven systems. By integrating behavioral metrics—focused on actions and beliefs—we reinforce the process and sustain improvement.
Behavioral Metrics & Tools
Behavior is broken into two functions:
- Intellectual (Cognitive): Changing beliefs, knowledge, and vision.
- Action: Changing what is done, how it’s done, and what is gained.
Assessment begins with a baseline of current beliefs. For example, the myth that “dropping everything to fix a breakdown is heroic” is replaced with the belief that “zero breakdowns and planned maintenance drive profitability.”
Desired behaviors are identified early (e.g., attending planning meetings prepared, knowing upcoming tasks, having parts available before work starts). These become the green‑light behaviors on the scorecard.
Tools such as the System Installation Status (SIS) and the Behavioral Pyramid track how well these behaviors are adopted. The SIS rates key elements from 0 (not agreed) to 6 (self‑sustaining), while the Behavioral Pyramid layers behaviors from basic to advanced, each with probing questions to gauge embedment.
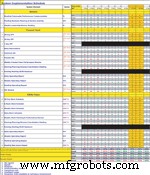
Figure 2 – System Installation Status
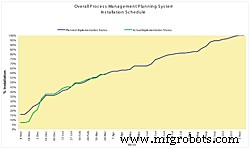
Figure 3 – Graphical Representation of SIS
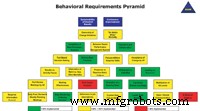
Figure 4 – Behavioral Requirements Pyramid
Why Behavior Focus Is Key
Metrics measure performance; behaviors confirm sustainability. Certification tools that combine quantitative scores with qualitative behavior assessment can rank an organization on a 1–15 scale of competence, sustainability, or high performance. When a business unit fails certification, it often signals that behaviors have not aligned with the process, prompting corrective action and renewed focus.
Summary
- Both qualitative and quantitative measures are essential for change initiatives.
- Leading and lagging metrics embed the impact of worker behaviors.
- Behavior change assessment is integral to sustaining improvements.
- Quantitative metrics provide snapshots; behavioral metrics predict long‑term success.
To learn more about implementing the Managing System and driving maintenance excellence, contact Strategic Asset Management Inc. by phone (800‑706‑0702) or e‑mail (info@samicorp.com). Visit our website at www.samicorp.com.
Equipment Maintenance and Repair
- Fog Computing: The Future of Industrial IoT for Real‑Time, Reliable Operations
- Unlocking Operational Excellence: The Strategic Advantage of Optimized Maintenance Scheduling
- Choosing the Optimal Drive System: Chain, V‑Belt, or Synchronous Belt
- Choosing the Optimal Drive System: Cost and Performance Insights
- IoT: Mastering the Data Surge for Business Transformation
- 5 Essential Tips for Selecting the Ideal Order Management System
- Choosing the Right Inventory System for Your Warehouse: A Practical Guide
- Choosing the Ideal Tube Laser Cutting System for Your Manufacturing Needs
- Hydraulic Leak Hazards: Protecting Your System & Safety
- Why Hydraulic Systems Are Essential for Modern Engineering