


Fault Tree Analysis Explained: Purpose, Process, and Practical Implementation

Fault Tree Analysis (FTA) empowers engineers to anticipate failures before they occur. By mapping the causal chain from a top‑level event down to basic root causes, FTA turns abstract risk into a tangible, actionable plan.
From aerospace to healthcare, organizations rely on FTA to build resilience, reduce downtime, and safeguard lives.
What Is Fault Tree Analysis?
FTA is a top‑down, graphical method that models how component failures propagate to a system‑wide event. It combines Boolean logic with probability theory, allowing reliability engineers to design fault‑tolerant systems that resist cascading failures.
In practice, an FTA diagram shows how a single component failure can trigger a chain reaction, leading to a catastrophic outcome. This visual insight guides preventive measures, redundancy design, and maintenance planning.
Historical Roots
FTA originated in 1962 at Bell Telephone Laboratories. Engineers were tasked with safeguarding the Minuteman intercontinental ballistic missile system for the U.S. Air Force. The method extended the concepts of Failure Modes and Effects Analysis (FMEA) by adding a graphical dimension that made complex safety data accessible and actionable.
Boeing quickly adopted FTA, and it has since become a cornerstone of safety analysis in high‑risk industries.
When to Use FTA
FTA is versatile: it can be applied during system design to pre‑empt potential failures, or in operation to evaluate emerging risks. It is often used in conjunction with FMEA to create a comprehensive safety strategy.
Who Employs FTA?
- Aerospace, defense, and aviation
- Power generation and grid safety
- Cybersecurity and IT infrastructure
- Specialty chemical manufacturing
- Healthcare devices and pharmaceuticals
- Environmental and disaster management
In each sector, a single failure can have catastrophic consequences. FTA provides the systematic approach needed to protect people and assets.
Why FTA Matters
- Identifies root causes, not just symptoms
- Facilitates systematic, prioritized maintenance
- Assesses interdependencies among subsystems
- Incorporates human error and probabilistic data
- Supports design of redundant, fault‑tolerant systems
Fault Tree Symbols & Structure
An FTA diagram is a directed acyclic graph (DAG) composed of events and gates.
Event Symbols
Events represent occurrences that can contribute to a failure. Each event has a single input and a single output.
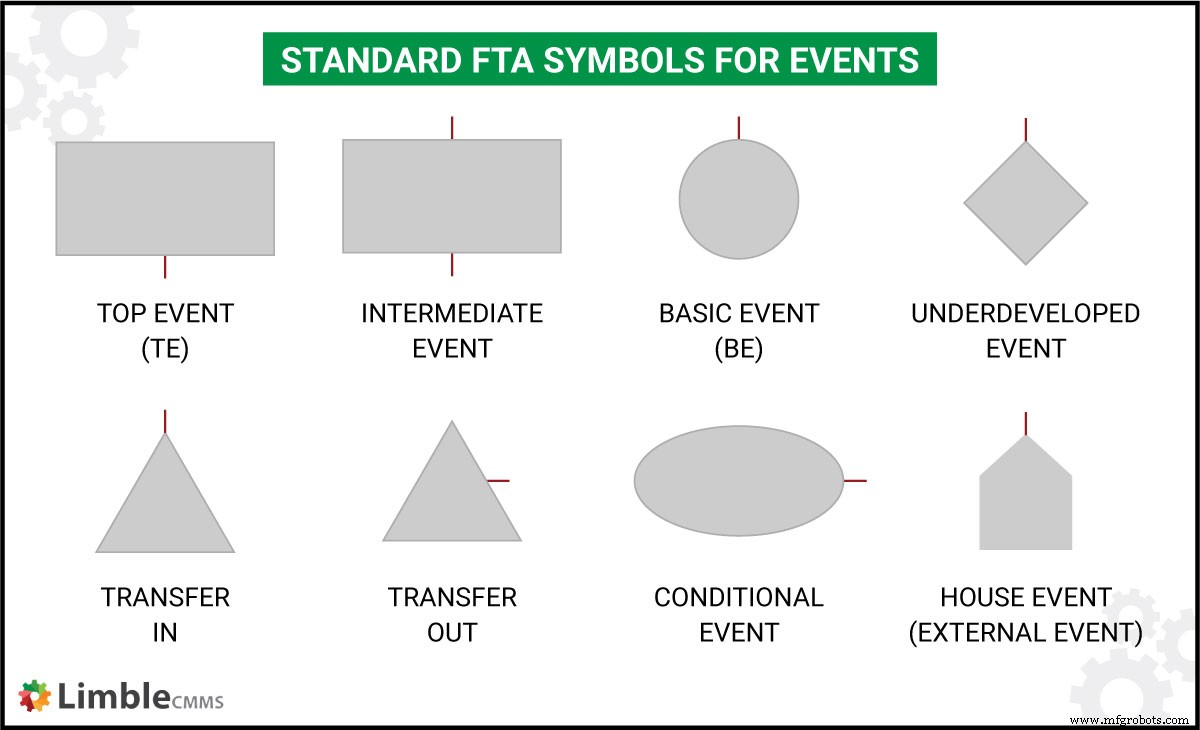
- Top Event (TE) – The catastrophic outcome of interest, depicted as a rectangle with no output.
- Basic Event (BE) – Fundamental failure causes, shown as circles with no input.
- Intermediate Event – Events triggered by other events; rectangles with both input and output.
- Transfer Event – Used to simplify large trees; represented by triangles.
- Underdeveloped Event – Indicates insufficient data; shown as a diamond.
- Conditional Event – Conditions for INHIBIT gates; depicted as ovals.
- House Event – External events with probability 0 or 1; represented as rectangles.
Gate Symbols
Gates illustrate how failures combine via Boolean logic.
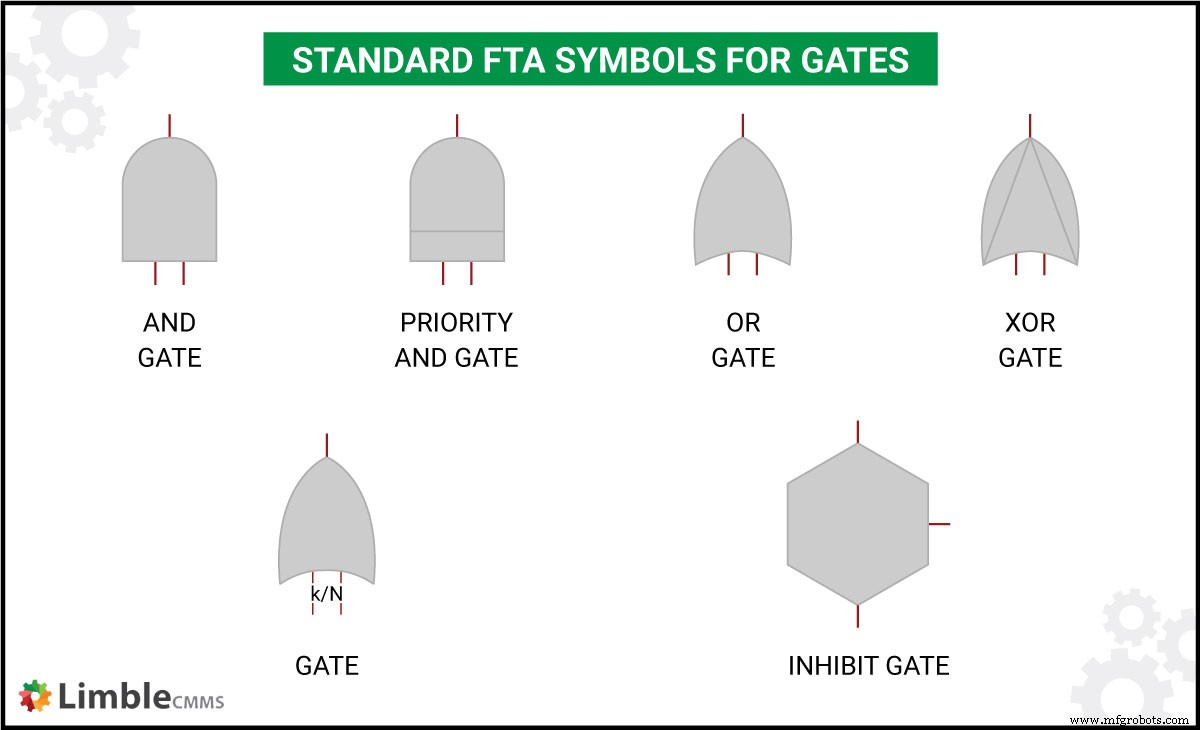
- AND Gate – Output occurs only if all inputs occur.
- Priority AND Gate – All inputs must occur in a specific sequence.
- OR Gate – Output occurs if any input occurs.
- XOR Gate – Output occurs if exactly one input occurs.
- k/N (Voting) Gate – Output occurs if at least k out of N inputs occur.
- INHIBIT Gate – Output requires all inputs plus a conditional event.
Types of FTA
- Dynamic FTA – Models time‑dependent behaviors.
- Repairable FTA – Incorporates repair actions and maintenance.
- Extended FTA – Handles multi‑state components and random probabilities.
- Fuzzy FTA – Uses fuzzy set theory for uncertain factors.
- State‑Event FTA – Analyzes dynamic system behavior beyond static trees.
Qualitative and quantitative FTA differ in scope: qualitative analysis is performed for every project, while quantitative analysis is added when probability data is available.
Qualitative FTA
- Minimal Cut Sets (MCS) – Identify the smallest sets of failures that can trigger the top event.
- Minimal Path Sets (MPS) – Determine the minimal set of functioning components required for system success.
- Common Cause Failures (CCF) – Detect single elements that could cause multiple failures.
Quantitative FTA
- Calculates explicit failure probabilities using known basic event probabilities.
- Produces stochastic measures (overall failure probability) and importance measures (criticality of components).
Example: If basic events A, B, C, and D have known probabilities, an AND gate combines A, B, and C into an intermediate event E; an OR gate then links E with D to produce the top event TE. The probability of TE is derived through Boolean algebra.
Step‑by‑Step FTA Process
1. Assemble a Diverse Team
Include engineers, maintenance staff, and operational personnel. A skilled facilitator steers the brainstorming sessions and ensures all perspectives are considered.
2. Define the Top Event
Identify the catastrophic outcome you want to prevent. Begin the diagram with this event and work downward.
3. Map System Knowledge
Collect schematics, component specifications, and manufacturer data. A deep understanding of the system’s architecture is essential for accurate modeling.
4. Construct the Fault Tree Diagram
Use the standardized symbols and gates to represent how failures propagate.
5. Identify MCS, MPS, or CCF
- Use MCS to target the most vulnerable elements.
- Use MPS to focus on critical components that keep the system running.
- Use CCF to highlight shared failure sources.
Optional: Compute Failure Probabilities
When basic event probabilities are available, calculate the likelihood of each critical path or cut set. Prioritize mitigation based on these values.
6. Develop Mitigation Strategies
- Implement redundancy for MPS components.
- Schedule preventive maintenance for CCFs.
- Use a CMMS (e.g., Limble) to track tasks and spare parts.
Practical FTA Examples
Car Won’t Start
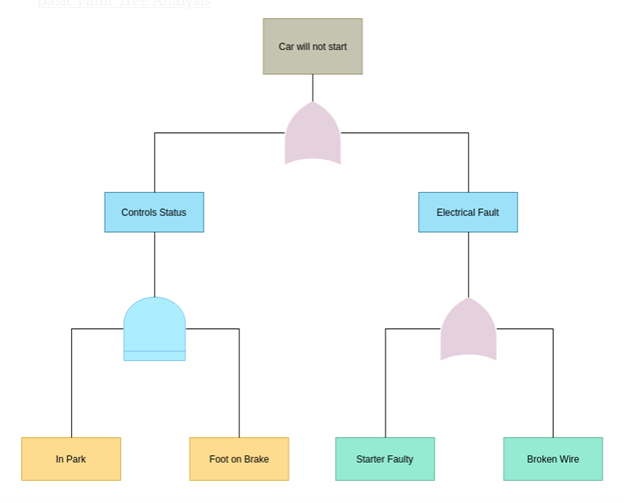
The top event is “vehicle does not start.” An OR gate links three primary causes: battery failure, low fuel, and stalled ignition. Each branch is further broken down into basic events such as a flat battery, a drained alternator, or a faulty starter motor.
Server Catastrophic Failure
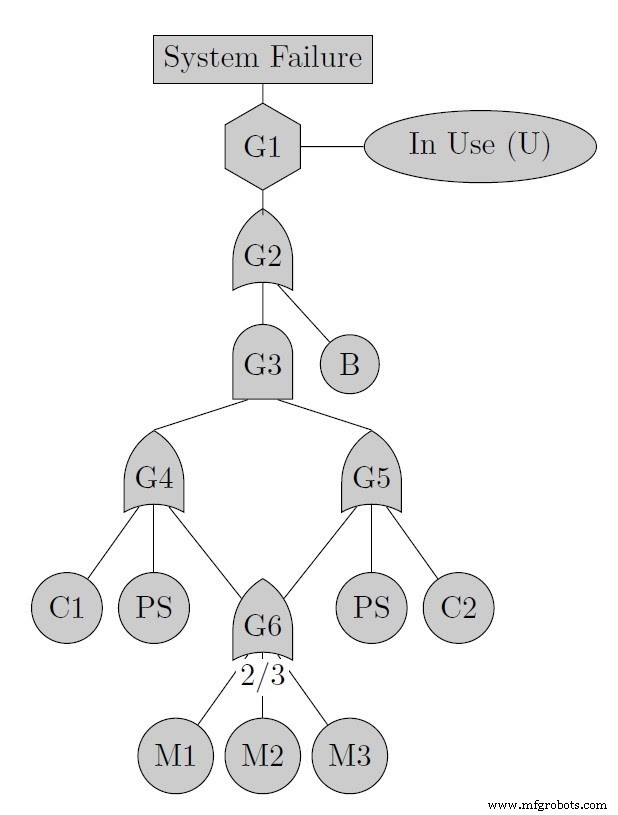
This diagram illustrates a server with redundant CPUs, shared memory, and a single power supply. INHIBIT gates model maintenance windows, while voting gates capture the requirement that at least two memory modules fail to trigger system failure.
FTA vs. Other Analytical Methods
Failure Modes and Effects Analysis (FMEA)
FTA uses a top‑down approach, focusing on the final event. FMEA is bottom‑up, exploring potential failures at each component level. FTA captures interdependencies that FMEA may overlook.
Failure Mode, Effects, and Criticality Analysis (FMECA)
FMECA extends FMEA by ranking failures based on criticality, enabling prioritized action.
Event Tree Analysis (ETA)
ETA answers “what if” questions from a single initiating event, commonly used in financial sectors. It lacks the broader system‑wide perspective that FTA offers.
Leveraging FTA Software
Complex systems can produce trees that are unwieldy on paper. Software solutions automate diagramming, calculation of MCS/MPS/CCF, and probability analysis.
- Visual Paradigm – Feature‑rich with a free trial.
- Blocksim (ReliaSoft) – Part of a broader reliability suite.
- ALD Fault Tree Analyzer – Free, cloud‑based option.
Choose a tool that aligns with your industry’s needs and your team’s workflow.
Further Reading
- "Fault Tree Analysis Primer" by Clifton A. Ericson II
- "Fault Tree Analysis: A Complete Guide" by Gerardus Blokdyk
- Coursera courses on FTA
- YouTube lectures from IIT Kharagpur’s Department of Industrial and Systems Engineering
- Videos by xSeriCon, engineering consultancy and safety training firm
Conclusion
Mastering FTA transforms reactive maintenance into proactive risk management. With the right team, methodology, and tools, you can predict failures, prioritize actions, and keep critical systems operating safely.
Limble’s CMMS supports every phase of FTA, from data collection to maintenance scheduling. Contact us to learn how our platform can streamline your reliability engineering efforts.
Equipment Maintenance and Repair
- Criticality Analysis: How to Prioritize Assets and Maximize Reliability
- Wrench Time: Definition, Importance, and Measurement
- Criticality Analysis: Identifying & Prioritizing High‑Risk Equipment
- Breakdown Maintenance Explained: Rapid Response & Cost Control
- Asset Utilization Explained: How to Measure and Maximize Returns
- Mastering Productive Efficiency: A Practical Guide to Maximizing Manufacturing Performance
- Exploring 6G: The Future of Ultra-Fast Connectivity
- Copper Brazing Explained: Techniques & Tips for Strong, Reliable Connections
- Mastering Manufacturing Capacity Analysis: A Practical Guide
- Master Copper Brazing: A Complete Guide to Joining Tubes & Fittings