


Understanding AC Voltage and Current Magnitudes: Peak, RMS, and More
AC voltage alternates polarity and AC current alternates direction. By recording how these quantities change over time, we can plot them as a waveform.
Measuring the time it takes for a waveform to complete one cycle gives the period; its reciprocal is the frequency, which in music corresponds to pitch.
While DC quantities are straightforward to express because they remain constant, AC quantities are continuously changing, making a single magnitude value more complex to define.
Common Ways to Express AC Amplitude
1. Peak (Crest) Value – the maximum height of the waveform measured from the zero line to the highest positive or lowest negative point.
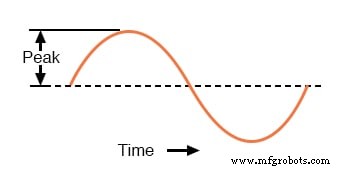 Peak voltage of a waveform.
2. Peak‑to‑Peak (P‑P) Value – the total vertical span from the maximum positive to the maximum negative peak.
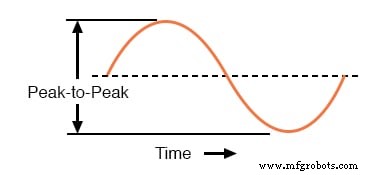 Peak‑to‑peak voltage of a waveform.
These measurements can be misleading when comparing different wave shapes. A square wave that peaks at 10 V delivers more power over time than a triangle wave that peaks at the same voltage.
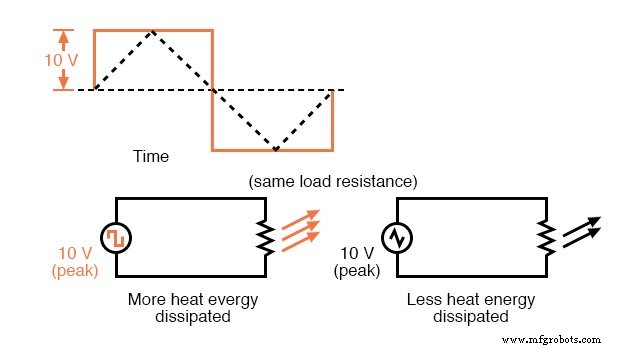 A square wave produces a greater heating effect than the same peak voltage triangle wave.
3. Average Value – the arithmetic mean of all points in one cycle. For symmetric waveforms, the algebraic average is zero because positive and negative areas cancel. Practically, the average is defined as the mean of the absolute values of all points, giving a positive number that reflects the waveform’s overall magnitude.
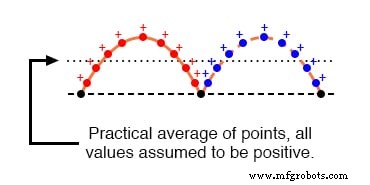 Waveform seen by AC average responding meter.
Mechanical meters with polarity‑insensitive movements naturally average the waveform because their inertia dampens rapid swings. Polarity‑sensitive meters oscillate about zero and only show the algebraic average, which is zero for symmetric waves.
4. Root Mean Square (RMS) Value – the most meaningful metric for power calculations. RMS is defined as the square root of the mean of the squared waveform values. It represents the DC voltage or current that would dissipate the same amount of heat in a resistor as the AC waveform.
Example: A 2 Ω resistor dissipates 50 W of heat when driven by a 10 V DC source. The AC source that produces the same heating effect is described as 10 V RMS. The RMS value is calculated by squaring the waveform, averaging, and taking the square root.
RMS is often called the DC equivalent or simply the equivalent value. It is the preferred measurement for power, wire ampacity, and most engineering calculations.
Peak values are critical when evaluating insulation or devices that can be damaged by transient spikes, such as high‑voltage AC systems.
Measuring Instruments
Peak and peak‑to‑peak values are best captured with an oscilloscope, which can record waveform crests accurately. RMS values require meters calibrated for RMS. Analog electromechanical meters (D’Arsonval, Weston, iron‑vane, electrodynamometer) must be skewed for RMS and are accurate only for the waveshape used during calibration—usually a sine wave.
True‑RMS meters use a heating element whose temperature is proportional to the RMS voltage. This method is independent of waveform shape and provides the most accurate RMS measurement.
Conversion Factors for Common Waveforms
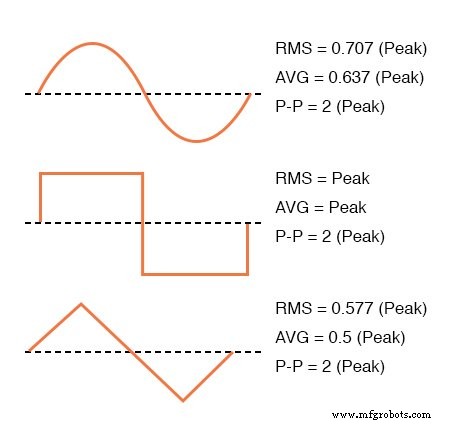 Conversion factors for common waveforms.
The table lists the relationships between peak, peak‑to‑peak, average (practical), and RMS values for sine, square, and triangle waves. For distorted waveforms, no simple conversion exists.
Key ratios include:
- Crest factor – Peak divided by RMS.
- Form factor – RMS divided by average.
- For a sine wave: RMS = 0.707 × Peak; Average = 0.637 × Peak; Form factor = 1.11.
- For a square wave: RMS = Peak; Form factor = 1.
- For a triangle wave: RMS = 0.577 × Peak; Form factor = 1.15.
Limitations of Analog RMS Meters
Analog meters calibrated for sine‑wave RMS are accurate only for pure sine waves. For other waveforms, the meter indicates the average value scaled by the sine‑wave form factor (1.1107), leading to a systematic error. True‑RMS meters avoid this limitation.
Review
- AC amplitude can be expressed as peak, peak‑to‑peak, average, or RMS.
- Peak (crest) is the highest positive or lowest negative point.
- Peak‑to‑peak is the total height from max positive to max negative.
- Average is the mean of absolute values over one cycle; for a sine wave it is about 0.637 × Peak.
- RMS is the DC equivalent; for a sine wave it is about 0.707 × Peak.
- The crest factor is Peak ÷ RMS.
- The form factor is RMS ÷ Average.
- Electromechanical meters respond to the average value; RMS calibration must match the waveform shape.
Related Worksheets
- Basic Oscilloscope Operation Worksheet
Industrial Technology
- Advanced Waveform Analysis with Winscope: From Time‑Domain to Frequency Domain
- Representing AC Voltages and Currents as Vectors
- Mastering Pressure Measurements in Automotive Engineering
- Revolutionizing Health Monitoring: Sensor‑Based Vital Sign Measurements
- Revolutionary Ghost Imaging Enhances Precision of Atmospheric Gas Measurements
- Arduino Due Arbitrary Waveform Generator – Powerful, Multi‑Frequency, Linux/Windows Compatible
- Precision Measurements 101: Essential Metrology for Manufacturing Excellence
- Unlocking Precision: Measuring with a Fine-Toothed Comb
- Precision Infrared Temperature Sensing for Color‑Sensitive Processes
- PSI, CFM, and HP Explained: Choosing the Right Air Compressor