


Advanced Waveform Analysis with Winscope: From Time‑Domain to Frequency Domain
PARTS AND MATERIALS
- IBM‑compatible personal computer with a sound card, running Windows 3.1 or later.
- Winscope – a free, downloadable oscilloscope‑style application.
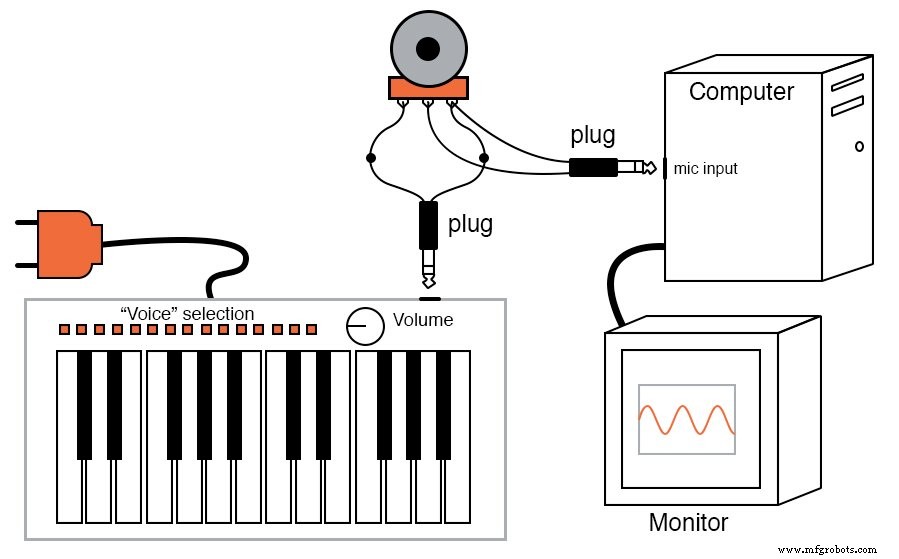
- Electronic musical keyboard.
- Mono (single‑channel) headphone jack for the keyboard.
- Mono jack for the computer’s microphone input, with wiring for voltage sources.
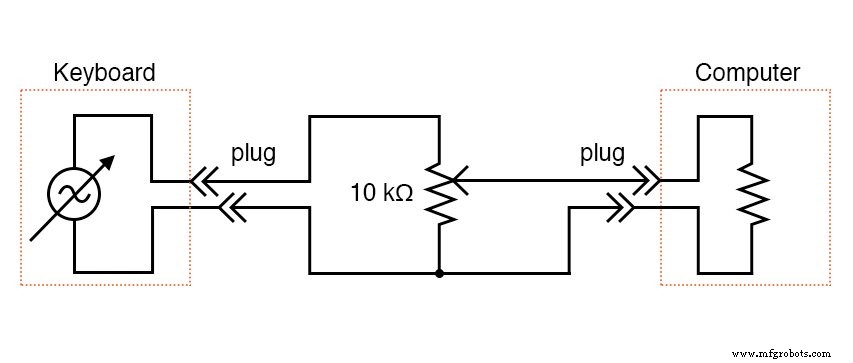
- 10 kΩ potentiometer.
All components are the same as those used in the “PC oscilloscope” experiment.
CROSS‑REFERENCES Lessons In Electric Circuits, Volume 2, chapter 7: “Mixed‑Frequency AC Signals”.
LEARNING OBJECTIVES
- Distinguish between time‑domain and frequency‑domain representations.
- Build an intuitive grasp of Fourier analysis.
SCHEMATIC DIAGRAM
ILLUSTRATION
INSTRUCTIONS
Winscope offers more than the classic “time‑domain” view. By clicking the rainbow icon, you switch to a frequency‑domain display that plots amplitude versus frequency. While a time‑domain oscilloscope shows how a waveform evolves over time, the frequency‑domain view reveals the harmonic makeup of a signal, making it invaluable for spectral analysis.
To see this in action, generate a sine wave with the keyboard’s panflute or flute voice and observe a single spike in the frequency plot. Hovering the cursor over the peak displays the exact frequency at the screen’s bottom.
Playing two notes simultaneously produces two distinct peaks, each corresponding to one of the notes. Basic chords (three notes) yield three spikes, and so forth. Switch back to the time‑domain view with the rainbow icon to compare the complex waveform with its clean spectral counterpart.
A chord that looks tangled in the time domain simplifies dramatically when plotted in frequency domain. Experiment with different keyboard voices, noting how symmetric waveforms generate only odd harmonics, while asymmetric shapes introduce even harmonics. Use the cursor to pinpoint peak frequencies and a calculator to verify whether each harmonic is even or odd.
RELATED WORKSHEETS
- Signal Modulation Worksheet
- AC Waveforms Worksheet
- Mixed‑Frequency Signals Worksheet
Industrial Technology
- AC Analysis Configuration: Curves, Points, and Frequency Sweep Settings
- Verified SPICE Netlists & Example Circuits
- Component Failure Analysis: Troubleshooting Techniques for Series and Parallel Circuits
- Advanced Component Failure Analysis: Qualitative Techniques for Troubleshooting Complex Circuits
- Network Analysis Explained: Advanced Techniques for Complex Electrical Circuits
- Understanding AC Voltage and Current Magnitudes: Peak, RMS, and More
- Advanced Spectrum Analysis: Interpreting Waveforms and Harmonics
- Comprehensive Failure Analysis: Preventing Equipment Loss and Reducing Costs
- Understanding Reactive Power: Key Insights for Power System Reliability
- Understanding Failure Analysis: Key Insights for Manufacturing Excellence