


Advanced Spectrum Analysis: Interpreting Waveforms and Harmonics
Computer‑based Fourier analysis—particularly the Fast Fourier Transform (FFT) algorithm—is a cornerstone technique for dissecting waveforms into their spectral constituents. The same mathematical engine that powers SPICE’s .fourier feature is embedded in modern oscilloscopes and spectrum analyzers, enabling real‑time, high‑precision spectral measurement of live signals.
In this article we apply these tools to a variety of waveforms, from the purest sine to the richly textured tones of musical instruments, and extract practical rules about harmonic content.
Case Study 1: A Pure Sine Wave
We begin with a sine wave at 523.25 Hz—exactly the pitch of “C” an octave above middle C on a piano. The tone was generated by an electronic keyboard set to emulate a pan flute, chosen for its proximity to an ideal sine wave.
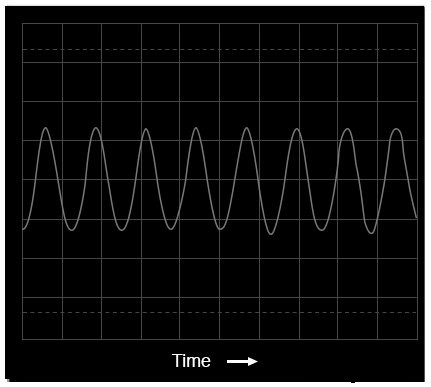
Oscilloscope display: voltage vs. time
While the oscilloscope reveals subtle deviations from a perfect sine—artifacts introduced by the measurement equipment—a spectrum analyzer presents a clean single‑peak spectrum at 523.25 Hz, with peak height proportional to the signal’s amplitude.
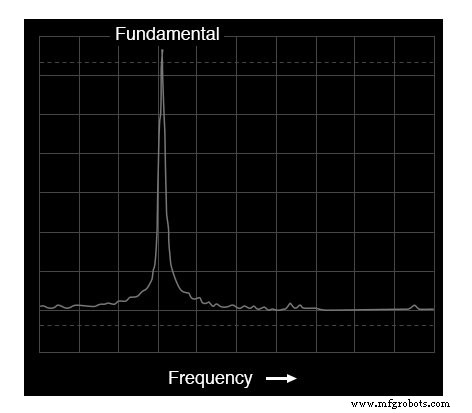
Spectrum analyzer display: voltage vs. frequency
Case Study 2: A C‑Major Chord (C‑E‑G)
Mixing three sine tones (C‑E‑G) on the keyboard produces a more complex time‑domain waveform and a multi‑peak frequency spectrum. The oscilloscope shows overlapping peaks of varying height, reflecting constructive and destructive interference among the tones.
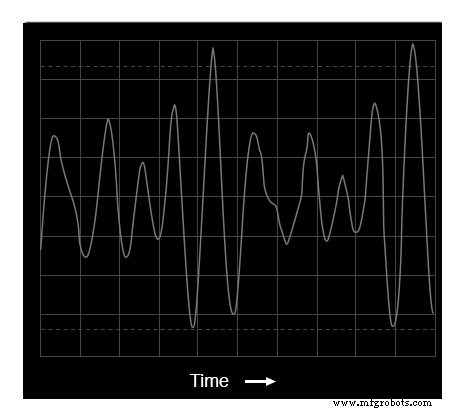
Oscilloscope display: three tones
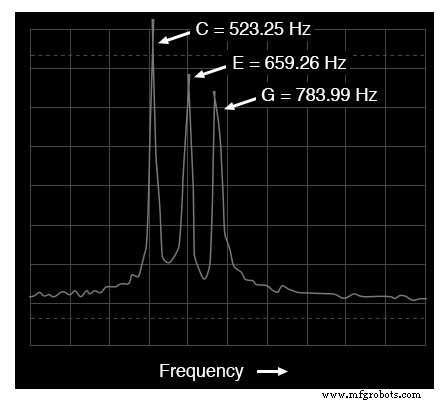
Spectrum analyzer display: three tones
Each pitch appears as a distinct peak. Minor variations in peak height stem from equipment limitations rather than intrinsic properties of the chord.
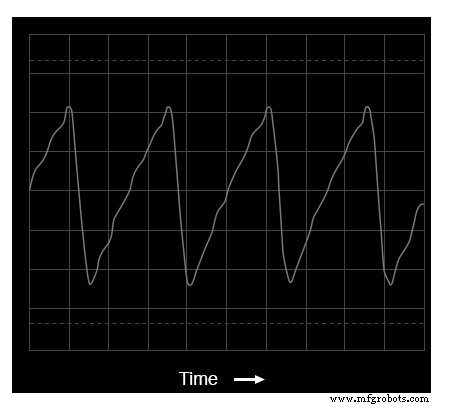
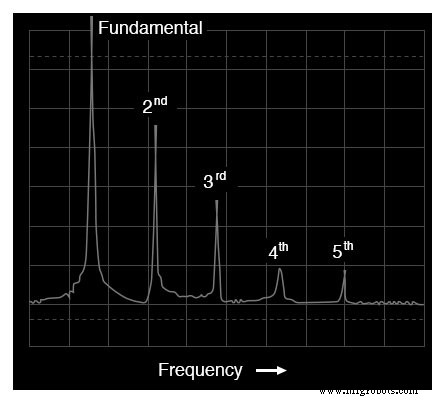
Case Study 3: Instrument Voices
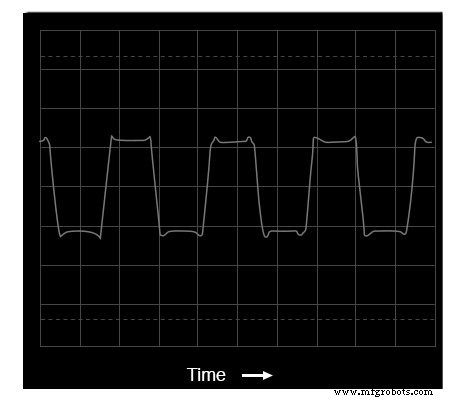
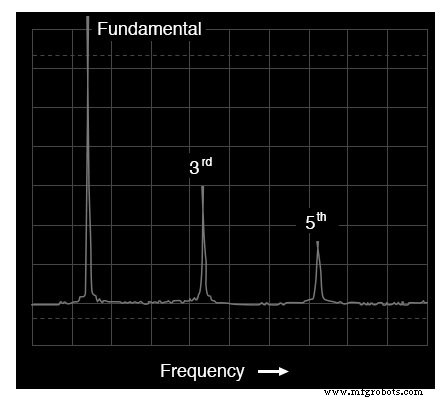
We next examine real instrument tones. A trumpet playing the same 523.25 Hz note exhibits a rich harmonic spectrum, with visible peaks at the fundamental and its first five harmonics (1046.5 Hz, 1569.75 Hz, etc.). This confirms that any non‑sine waveform can be decomposed into a sum of sinusoids at integer multiples of the fundamental frequency.
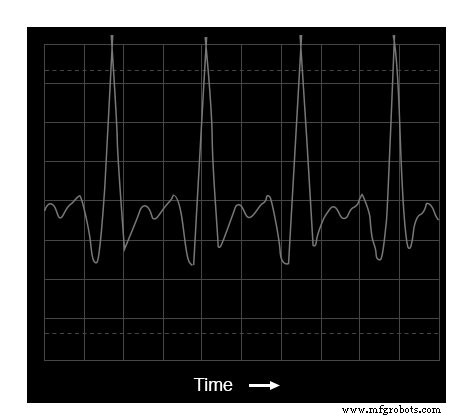
Oscilloscope display: trumpet waveshape
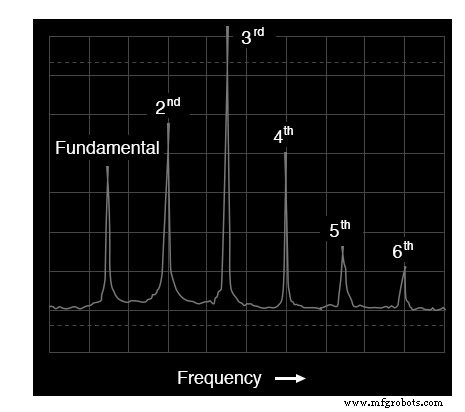
Spectrum of a trumpet tone
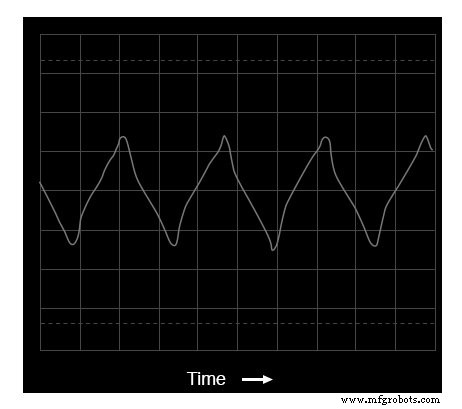
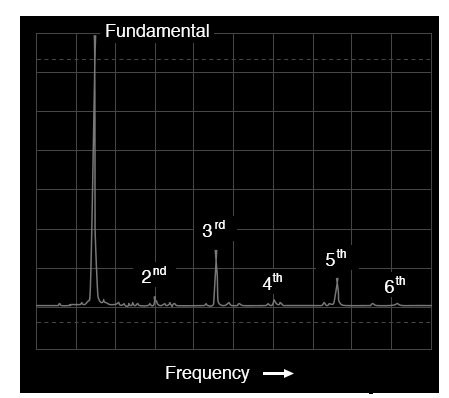
A similar analysis of an accordion tone reveals a comparable harmonic structure but with differing relative amplitudes. Both instruments generate harmonics up to and beyond the sixth order, yet their harmonic signatures are distinct.
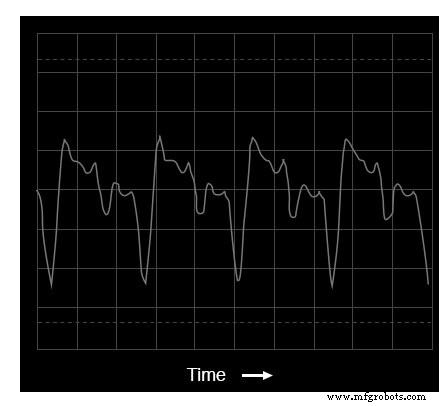
Oscilloscope display: accordion waveshape
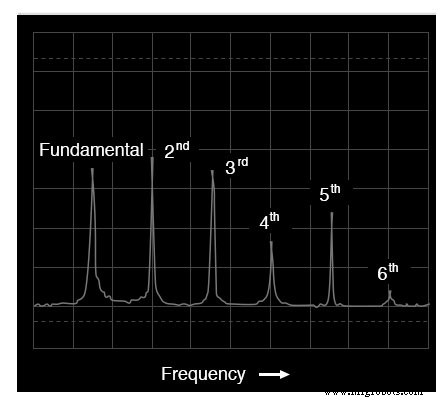
Spectrum of an accordion tone
These examples illustrate how waveform symmetry—or the lack thereof—governs the presence of even and odd harmonics.
Case Study 4: Square, Triangle, and Sawtooth Waves
A perfect square wave shows only odd harmonics; its spectrum reveals a descending series of odd‑multiple peaks.
Oscilloscope time‑domain display of a square wave
Spectrum (frequency‑domain) of a square wave
A triangle wave similarly lacks even harmonics, though its amplitude decays more rapidly with harmonic order.
Oscilloscope time‑domain display of a triangle wave
Spectrum of a triangle wave
In contrast, a sawtooth wave, which lacks symmetry about its centerline, exhibits strong even harmonics.
Time‑domain display of a sawtooth wave
Frequency‑domain display of a sawtooth wave
These observations lead to a general rule:
- Symmetric waveforms (mirror‑image about the centerline) contain only odd harmonics.
- Asymmetric waveforms contain both even and odd harmonics.
Adding a DC offset to any waveform does not alter its harmonic content; the symmetry about the centerline remains the decisive factor.
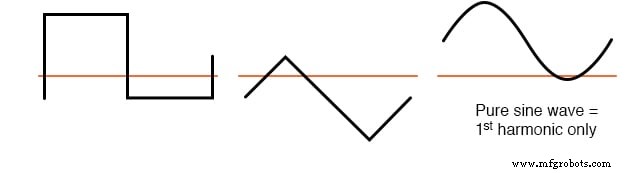
Symmetric waveforms contain only odd harmonics
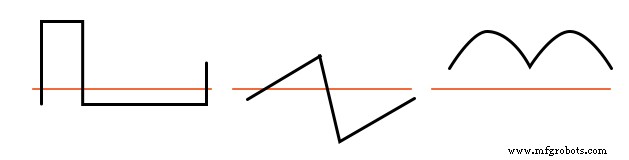
Asymmetric waveforms contain even harmonics
Understanding this principle is invaluable for power system designers and signal engineers alike. In AC power, symmetrical distortions rarely generate even harmonics, simplifying mitigation strategies. Conversely, the presence of even harmonics in a measurement often signals an asymmetrical distortion source, guiding troubleshooting efforts.
Finally, a rectifier circuit—a classic example of an asymmetric distortion—produces a strong even‑harmonic spectrum, confirming the rule’s practical relevance.
Review
- Symmetry about the horizontal centerline eliminates even harmonics.
- DC bias does not influence harmonic frequency content.
Related Worksheets
Industrial Technology
- Advanced Waveform Analysis with Winscope: From Time‑Domain to Frequency Domain
- Using the 4511 7‑Segment Decoder: A Practical BCD Display Tutorial
- AC Analysis Configuration: Curves, Points, and Frequency Sweep Settings
- Display Tubes: From CRTs to Cat‑Eye Indicators
- Component Failure Analysis: Troubleshooting Techniques for Series and Parallel Circuits
- Advanced Component Failure Analysis: Qualitative Techniques for Troubleshooting Complex Circuits
- Understanding Polarity and Phase in AC Circuit Analysis
- Maximizing Manufacturing Productivity: Strategies for Success
- Comprehensive Failure Analysis: Preventing Equipment Loss and Reducing Costs
- Understanding Human-Machine Interfaces (HMIs) in Modern Industry