


Build an Arduino‑Based Air Quality Monitor Using the DSM501A Dust Sensor
Components and supplies
 |
| × | 1 | |||
| × | 1 | ||||
 |
| × | 1 | |||
| × | 1 | ||||
 |
| × | 5 | |||
 |
| × | 1 | |||
 |
| × | 1 |
Necessary tools and machines
 |
|
Apps and online services
 |
|
About this project
Air quality monitoring is well known and established science which started back in the '80s. At that time, the technology was quite limited, and the solution used to quantify the air pollution complex, cumbersome and really expensive.
Fortunately, nowadays, with the most recent and modern technologies, the solutions used for air quality monitoring are becoming not only more precise, but also faster at measuring. Devices are becoming smaller, and cost much more affordable than ever before. The presented device uses the Samyoung "DSM501A" dust sensor which is one of the cheapest on the market and can be purchased at AliExpress for a few dollars.This sensor is capable of detecting PM2.5 as well as PM10 particles.
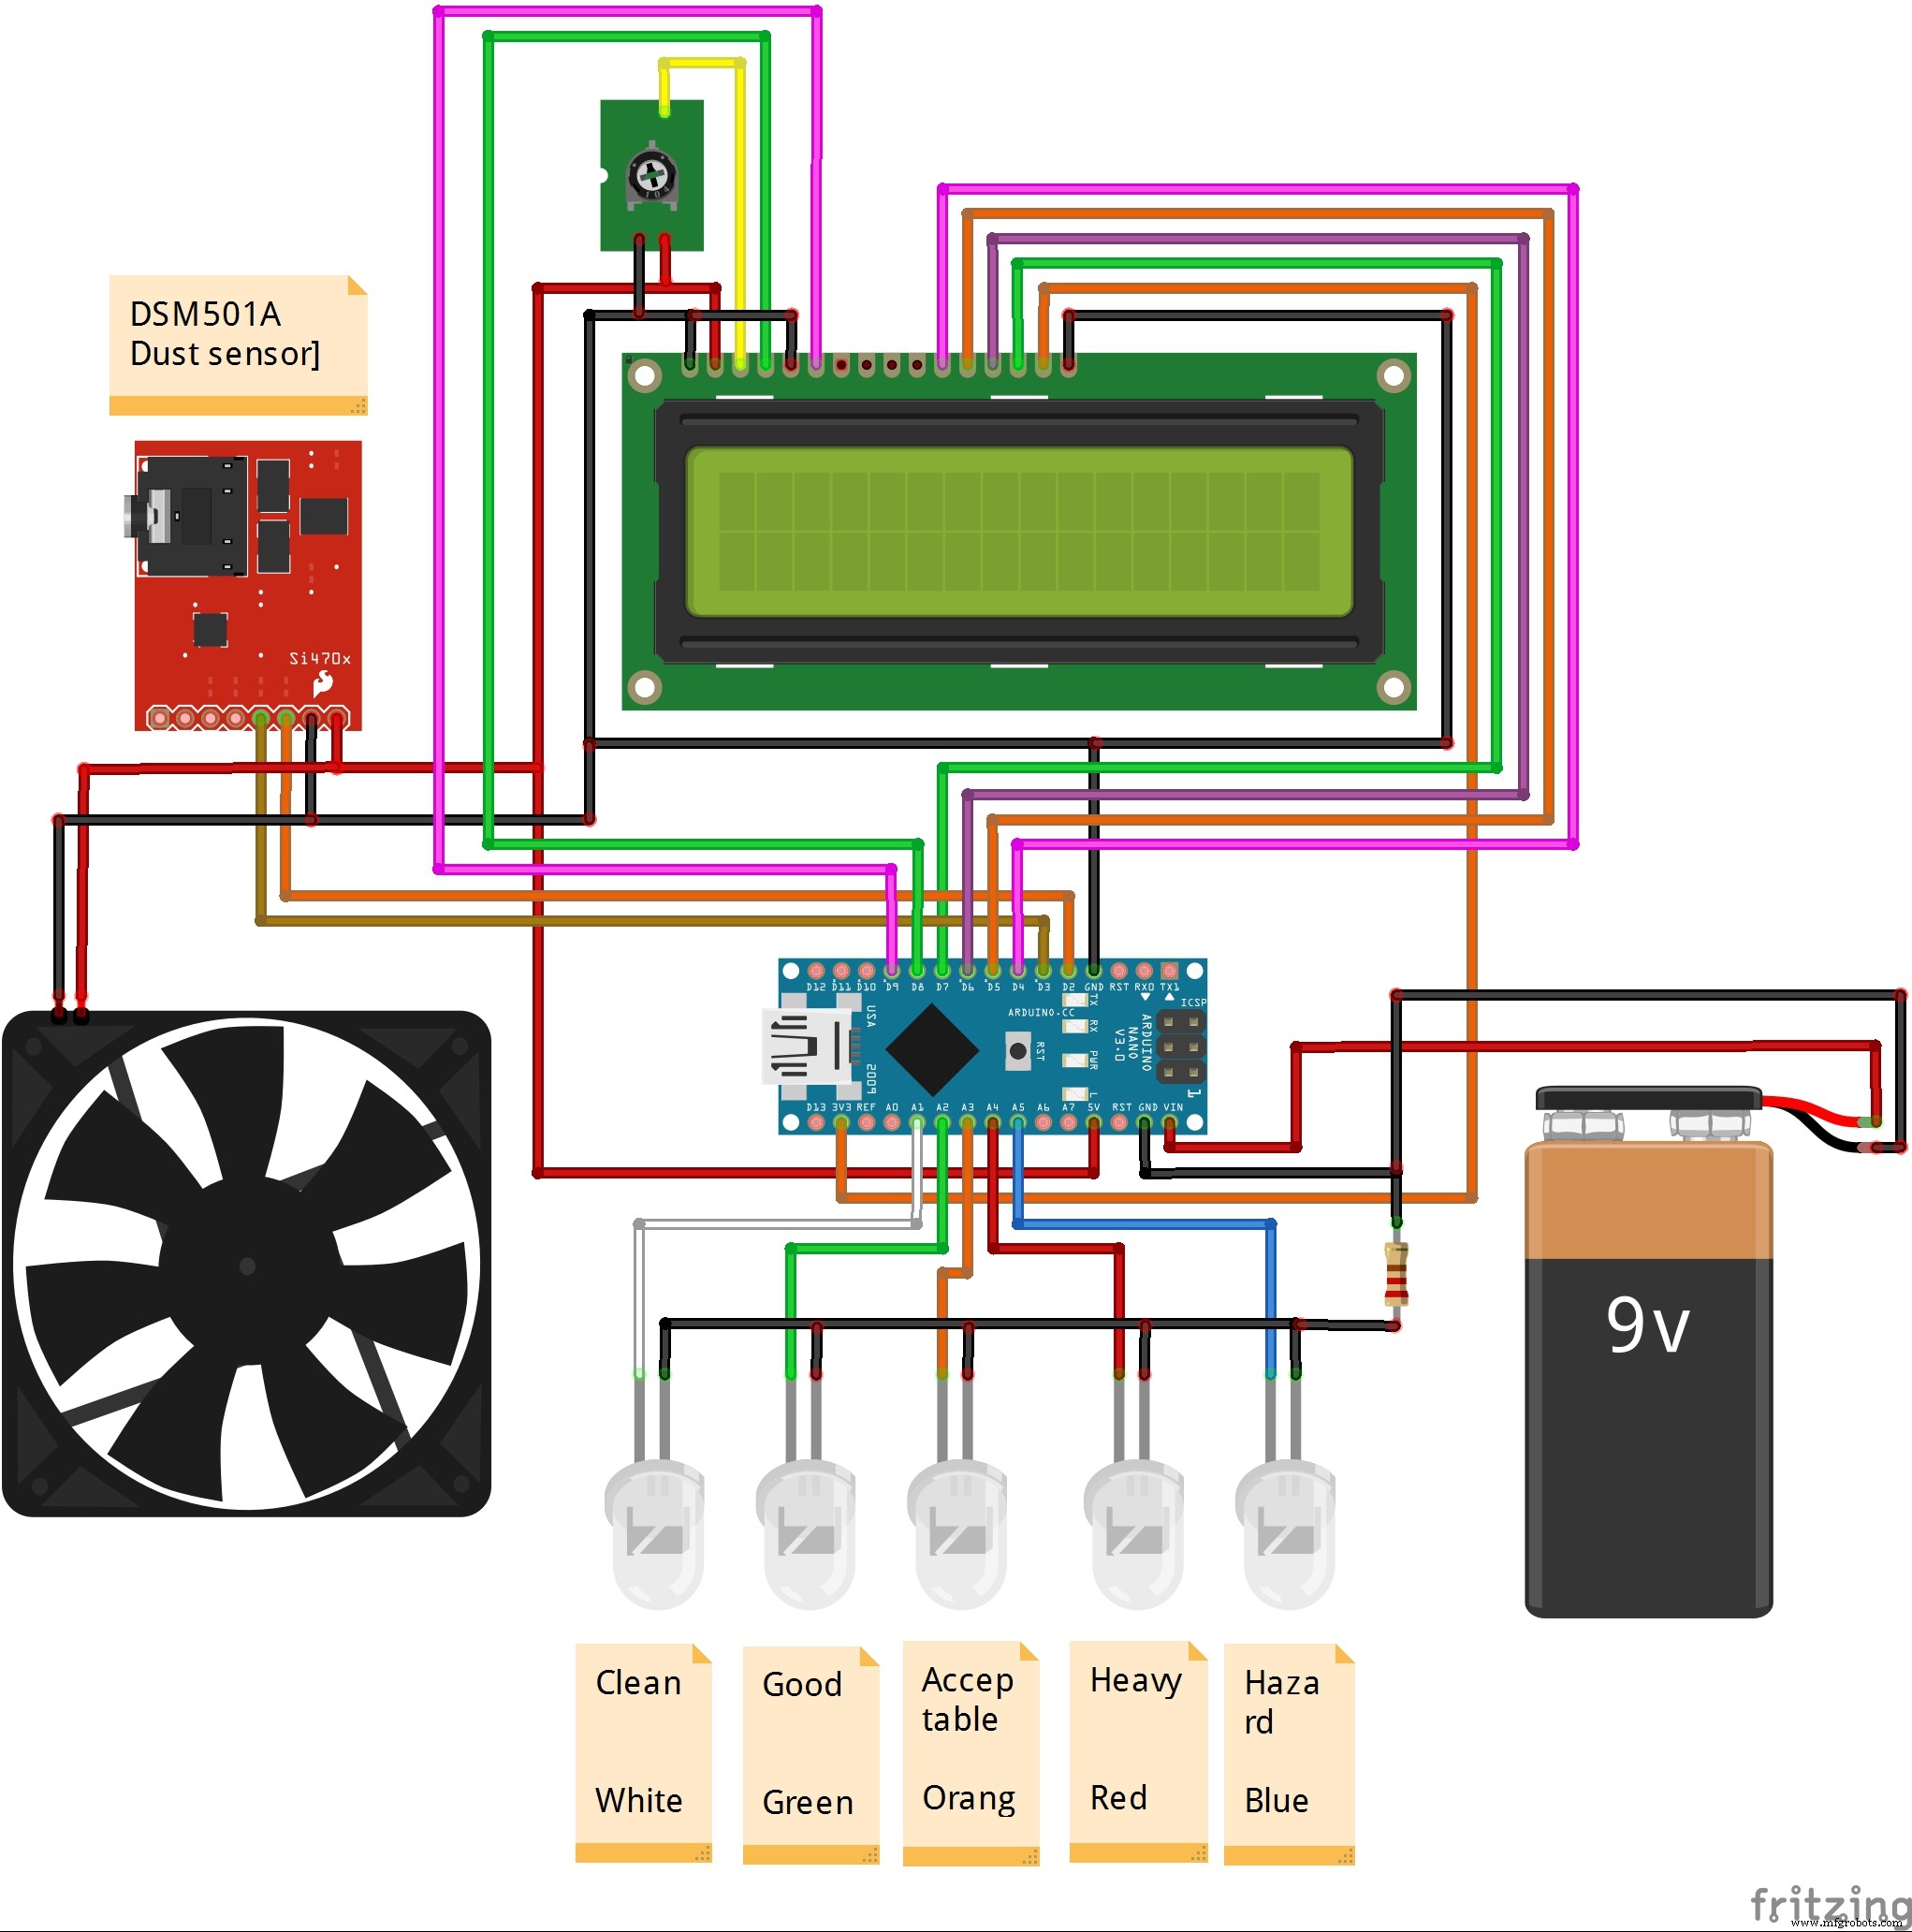
In the picture below, you can see the layout of the pins but don't pay attention to the color of the wires as they may be different.
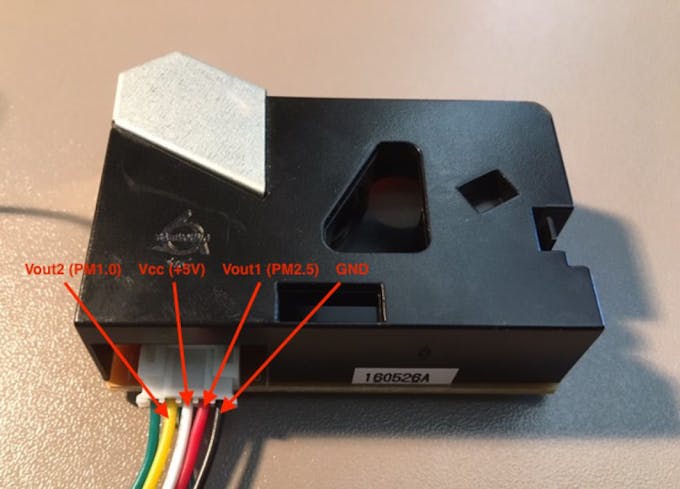
The circuit is very simple:
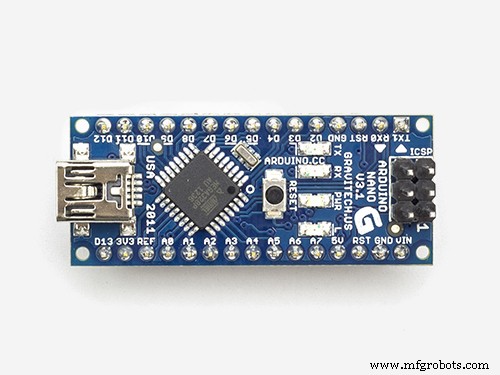
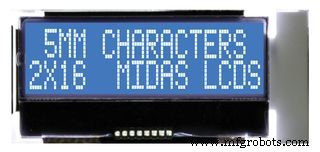
Vout1 (PM2.5) from sensor is connected to D2 of Arduino, Vout2 (PM10) to D3, Vcc to Arduino +5V, and GND to Arduino Gnd pin. The LED diodes are connected to the analog pins A1 to A5 of Arduino which are defined as outputs in the code.LCD display with 61x2 characters is compatible with the Hitachi HD44780. It shows the concentration of PM10 particles in pcs/0.01cf, and 5 states of air quality:
- Clean
- Good
- Acceptable
- Heavy
- Hazard
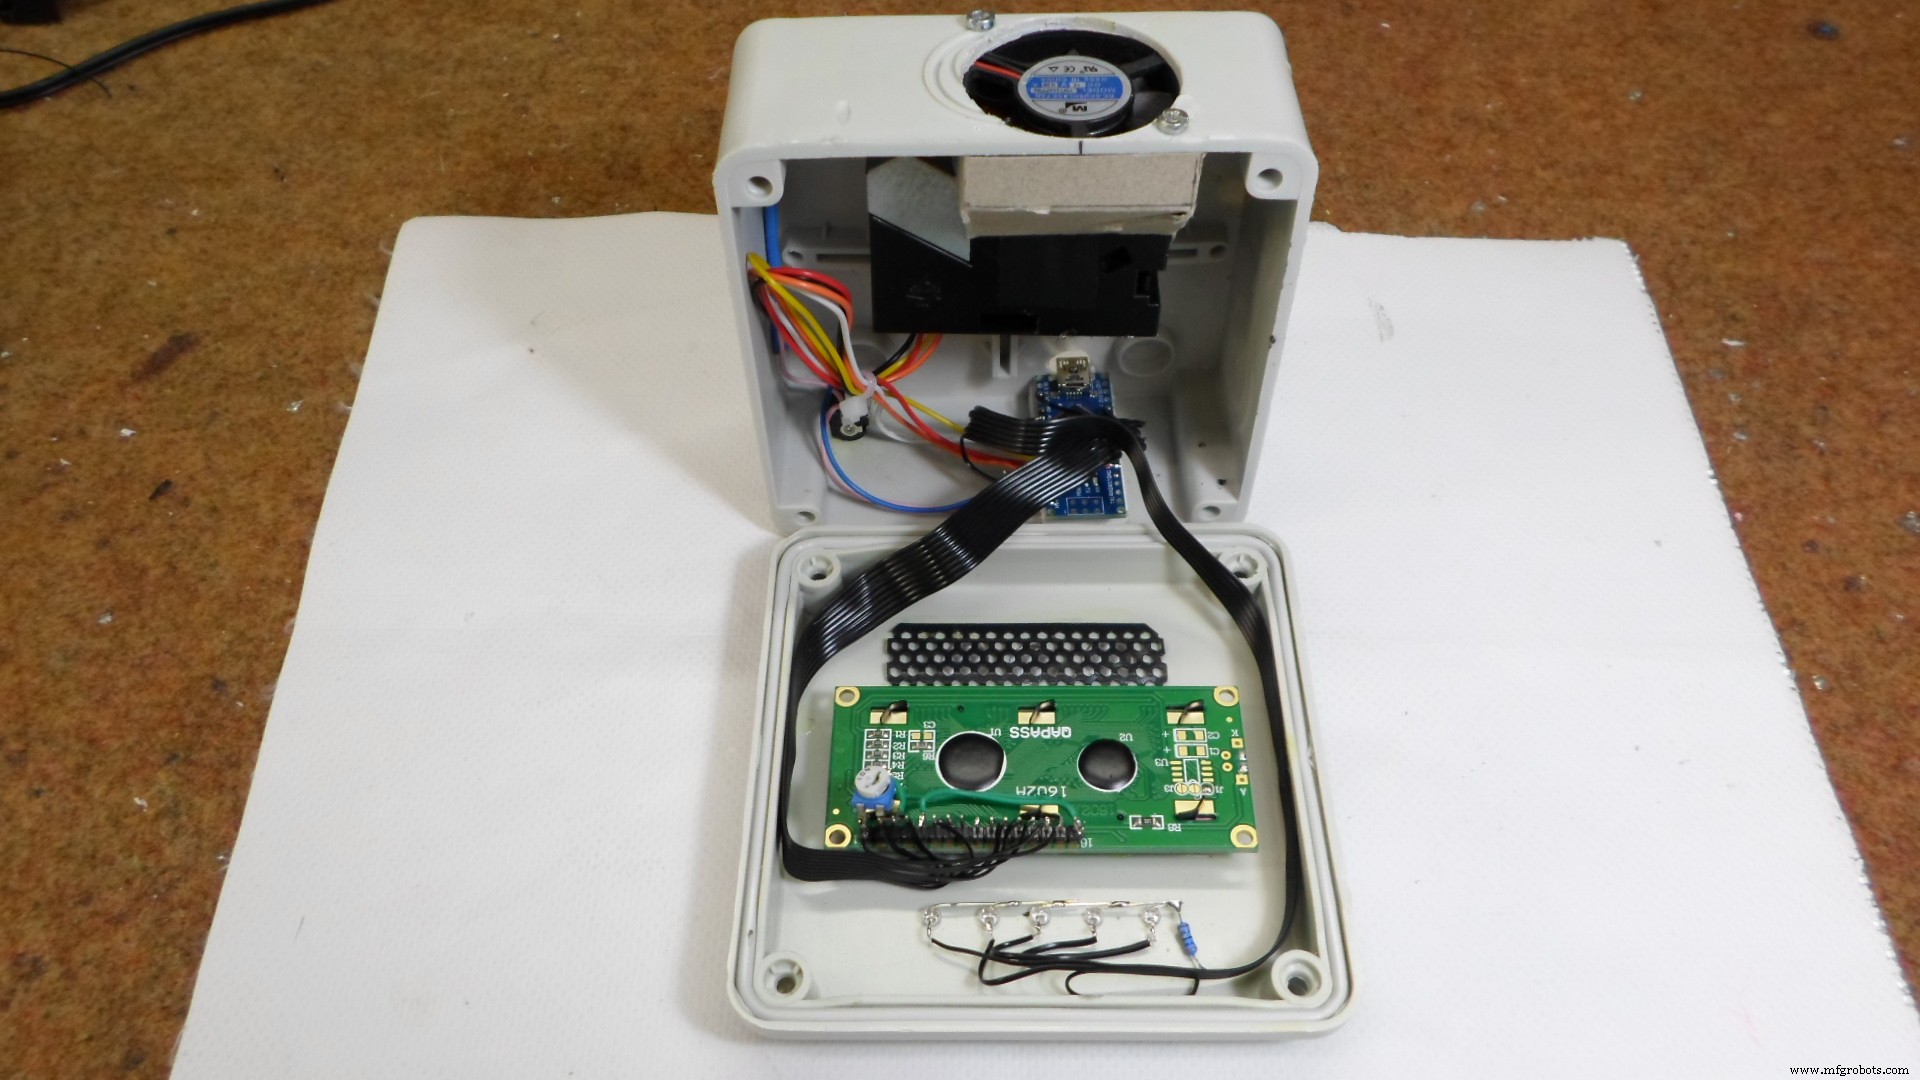
The concentration of both PM10 and PM2.5 can be monitored on the arduino serial monitor. Depending on the degree of contamination(PM10), an appropriate LED of a certain color will be lit to allow a quick and easy reading of the result. I don't have much experience in writing codes, so maybe the code can be improved. It is very important to emphasize that by installing a fan that draws air out of the sensor outlet, significantly improve the characteristics in the area of unwanted peak values. The whole device is assembled in a plastic box for electrical installation.
In the future, I plan to test a few more cheap dust sensors so you can find the results in one of my next projects.
Code
- code
codeArduino
 #include <LiquidCrystal.h>
LiquidCrystal lcd(8, 9, 4, 5, 6, 7);

int pin2 = 3;
int pin1 = 2;
unsigned long duration1;
unsigned long duration2;

unsigned long starttime;
unsigned long sampletime_ms = 3000;//sampe 1s ;
unsigned long lowpulseoccupancy1 = 0;
unsigned long lowpulseoccupancy2 = 0;
float ratio1 = 0;
float ratio2 = 0;
float concentration1 = 0;
float concentration2 = 0;
int wLed = A1;
int gLed = A2;
int yLed = A3;
int rLed = A4;
int bLed = A5;

void setup() {
  Serial.begin(9600);
  pinMode(2,INPUT);
  pinMode(3,INPUT);
  pinMode(wLed,OUTPUT);
  pinMode(gLed,OUTPUT);
  pinMode(yLed,OUTPUT);
  pinMode(rLed,OUTPUT);
  pinMode(bLed,OUTPUT);
  starttime = millis();//get the current time;
  lcd.begin(16, 2);
}

void loop() {
  duration1 = pulseIn(pin1, LOW);
  duration2 = pulseIn(pin2, LOW);
  lowpulseoccupancy1 = lowpulseoccupancy1+duration1;
  lowpulseoccupancy2 = lowpulseoccupancy2+duration2;


  if ((millis()-starttime) > sampletime_ms)//if the sampel time == 30s
  {
    ratio1 = lowpulseoccupancy1/(sampletime_ms*10.0);  // Integer percentage 0=>100
    concentration1 = 1.1*pow(ratio1,3)-3.8*pow(ratio1,2)+520*ratio1+0.62; // using spec sheet curve

    ratio2 = lowpulseoccupancy2/(sampletime_ms*10.0);  // Integer percentage 0=>100
    concentration2 = 1.1*pow(ratio2,3)-3.8*pow(ratio2,2)+520*ratio2+0.62; //

    lcd.setCursor(0, 0);
    lcd.print("PM10 ");
    lcd.setCursor(6, 0);
    lcd.print(concentration1,3);

    Serial.print("concentration1 = ");
    Serial.print(concentration1);
    Serial.print(" pcs/0.01cf  -  ");

    Serial.print("concentration2 = ");
    Serial.print(concentration2);
    Serial.print(" pcs/0.01cf  -  ");


    if (concentration1 < 1000) {
     lcd.setCursor (0, 1);
     for (int i = 0; i < 16; ++i)
   {
     lcd.write(' ');
   }

     lcd.setCursor(4, 1);
     lcd.print("CLEAN");

     digitalWrite(wLed, HIGH);
     digitalWrite(gLed, LOW);
     digitalWrite(yLed, LOW);
     digitalWrite(rLed, LOW);
     digitalWrite(bLed, LOW);
  }
    if (concentration1 > 1000 && concentration1 < 10000) {

     lcd.setCursor (0, 1);
     for (int i = 0; i < 16; ++i)
  {
     lcd.write(' ');
  }

     lcd.setCursor(4, 1);
     lcd.print("GOOD");

     digitalWrite(wLed, LOW);
     digitalWrite(gLed, HIGH);
     digitalWrite(yLed, LOW);
     digitalWrite(rLed, LOW);
     digitalWrite(bLed, LOW);
    }

    if (concentration1 > 10000 && concentration1 < 20000) {

    lcd.setCursor (0, 1);
    for (int i = 0; i < 16; ++i)
  {
    lcd.write(' ');
  }

      lcd.setCursor(4, 1);
     lcd.print("ACCEPTABLE");
     digitalWrite(wLed, LOW);
     digitalWrite(gLed, LOW);
     digitalWrite(yLed, HIGH);
     digitalWrite(rLed, LOW);
     digitalWrite(bLed, LOW);
    }
      if (concentration1 > 20000 && concentration1 < 50000) {
     lcd.setCursor (0, 1);
     for (int i = 0; i < 16; ++i)
  {
     lcd.write(' ');
  }
     lcd.setCursor(4, 1);
     lcd.print("HEAVY");
     digitalWrite(wLed, LOW);
     digitalWrite(gLed, LOW);
     digitalWrite(yLed, LOW);
     digitalWrite(rLed, HIGH);
     digitalWrite(bLed, LOW);
  }

    if (concentration1 > 50000 ) {
lcd.setCursor (0, 1);
for (int i = 0; i < 16; ++i)
{
  lcd.write(' ');
}

     lcd.setCursor(4, 1);
     lcd.print("HAZARD");
     digitalWrite(wLed, LOW);
     digitalWrite(gLed, LOW);
     digitalWrite(yLed, LOW);
     digitalWrite(rLed, LOW);
     digitalWrite(bLed, HIGH);

    }

    lowpulseoccupancy1 = 0;
    lowpulseoccupancy2 = 0;
    starttime = millis();
  }
}
Schematics
Manufacturing process
- Measuring Air Quality with OpenSensors: An Arduino & Python Guide
- Helium-Based Solar‑Powered Air Quality Sensor: Design & Deployment Guide
- Multi‑Position Temperature Sensor System for Smart Home Integration
- Create a Web-Enabled IoT Gauge Using Arduino, Yaler, and IFTTT
- Build a Precise Air Quality Monitor with the Sharp GP2Y1010AU0F Sensor
- Build a Compact CNC Machine with Arduino UNO
- Arduino-Based Indoor Air Quality & Comfort Sensor Kit
- Build an IR Sensor Project with Arduino UNO – Simple Guide
- Portable Arduino-Based Temperature & Humidity Monitor with 16x2 LCD Display
- Advanced Carbon‑Based NO₂ Sensor Enhances Indoor Air Quality Monitoring