


How Vibration Analysis Detects Bearing Wear in Industrial Chillers
In this case study, an outer‑race bearing defect on a 1,250‑ton (4,400‑kW) air‑conditioning chiller was identified using commercially available portable vibration analysis equipment and software.
The chiller is a single‑stage centrifugal compressor equipped with a rolling‑element thrust bearing on the motor‑free end and a sleeve bearing on the motor‑drive end. The diagnostic approach illustrated here applies to any rotating machine—pumps, fans, gears—that uses rolling‑contact bearings.
Vibration Analysis Tools
Over the past quarter‑century, vibration measurement tools have evolved dramatically. For most industrial machinery, a triaxial accelerometer remains the sensor of choice. While the raw output is proportional to acceleration, it is normally integrated and expressed in velocity units. All data in this case were collected with a triaxial accelerometer cluster, illustrated in Figure 2.
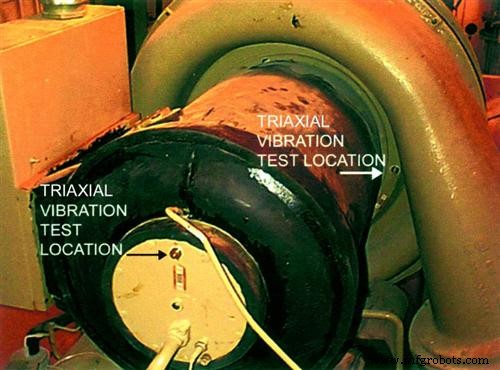
Figure 1. Chiller showing the vibration test location on the motor bearing housings.
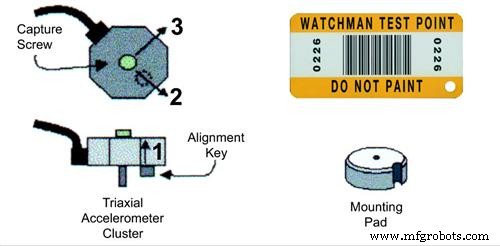
Figure 2. Sketch of a triaxial accelerometer cluster (left) that is stud‑mounted to the bronze disk mounting pad (bottom right). The cluster contains three accelerometers, each mutually perpendicular to the others. Vibration data collection is activated using a barcode that automatically configures the data collector, records, and stores the data.
The mounting pad is rigidly bonded to the motor bearing housing, and the triaxial cluster is stud‑mounted, enabling simultaneous collection of all three axes.
The barcode‑based setup guarantees repeatable, accurate data collection, regardless of who performs the test. Consistent operating conditions produce consistent data when the machine’s mechanical state remains unchanged.
Signal processing choices vary with the desired detail. Routine predictive‑maintenance programs typically gather two data types:
Overall level: A broadband vibration measurement that represents total amplitude over a wide frequency range. It is inexpensive to collect, process, and trend.
Narrowband: Using a Fast Fourier Transform (FFT), the vibration signal is decomposed into discrete frequencies, displayed as a 2‑D spectral plot of amplitude versus frequency. In this case, each spectrum contains 800 discrete peaks, offering fine frequency resolution.
Vibration Acceptance Criteria
What vibration level is acceptable for a 1,250‑ton (4,400‑kW) chiller? The manufacturer employs a pass/fail broadband specification of 0.25 in/s (peak). Acceptance limits are usually expressed as absolute or relative criteria.
The IRD General Machinery Vibration Severity Chart, summarized in Table 1, is a widely used absolute reference. Each condition band is separated by a factor of two in velocity, corresponding to a 6‑dB change in VdB.
Table 1. IRD General Machinery Vibration Severity Chart
| Machinery Condition | Velocity (in./speak) | Velocity (VdB) |
|---|---|---|
| Very Rough | >0.628 | >121 |
| Rough | 0.314 < V < 0.628 | 115 < VdB < 121 |
| Slightly Rough | 0.157 < V < 0.314 | 109 < VdB < 115 |
| Fair | 0.0785 < V < 0.157 | 103 < VdB < 109 |
| Good | 0.0392 < V < 0.0785 | 97 < VdB < 103 |
| Very Good | 0.0196 < V < 0.0392 | 91 < VdB < 97 |
| Smooth | 0.0098 < V < 0.0196 | 85 < VdB < 91 |
| Very Smooth | 0.0049 < V < 0.0098 | 79 < VdB < 85 |
| Extremely Smooth | <0.0049 | <79 |
Table 1. The IRD chart offers a graduated view of machine condition for frequencies between 1.6 and 1,667 Hz, applicable to most rotating equipment.
Absolute criteria are adequate for acceptance testing, but predictive maintenance demands more sensitive, relative criteria. Relative limits are derived by averaging vibration spectra from several identical machines under similar loads. For this study, spectra from 12 identical chillers were averaged. The bronze disk pads were mounted identically, and data were collected with each chiller running at roughly 80 % rated load.
After manual review, baseline spectra were established and standard deviations calculated. An “average + 1 σ” mask was then generated. Statistically, about 85 % of vibration amplitudes should fall below this mask. Unlike vendor‑defined pass/fail limits, this relative approach tailors acceptable ranges to the specific equipment.
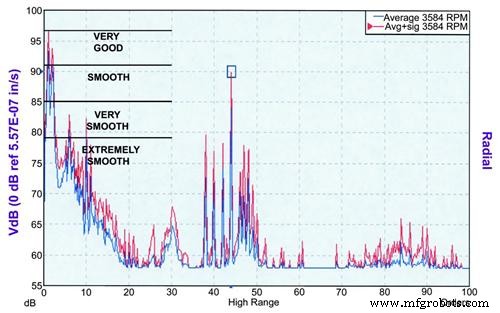
Figure 3. Relative acceptance criteria for the 1,250‑ton chiller, generated from 12 identical units. The blue spectrum is the average; the red curve is the average + 1 σ. For comparison, the IRD Severity Chart is overlaid.
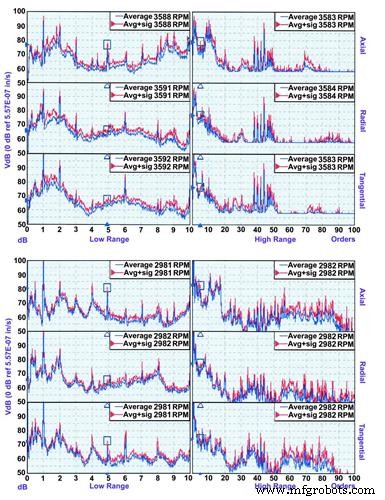
Figure 4. Baseline data from two facilities: Plant A (top six spectra) and Plant B (bottom six). Each plant hosts 18 identical chillers. Plant B’s running speed (2,982 rpm) reflects a 50‑Hz input line typical of Europe. The data represent the free‑end motor bearing.
Anti‑Friction Bearing Problems
Bearing faults are among the most common issues detected by vibration analysis. Early defects manifest as vibration components at frequencies that are not multiples of the shaft rotation rate. These non‑synchronous frequencies are determined by bearing geometry and can be approximated with the following rules:
Ball Pass Frequency Outer Race (BPFO) = # of rollers × shaft speed × 0.4
Ball Pass Frequency Inner Race (BPFI) = # of rollers × shaft speed × 0.6
Fundamental Train Frequency (FTF) = shaft speed × 0.4
The manufacturer specified an SKF 7318 bearing. Its table shows outer and inner ball‑pass frequencies of 4.9×M and 7.1×M, respectively, confirming a 12‑element bearing. As wear progresses, harmonics (integer multiples) of these ball‑pass frequencies appear in the spectrum. Depending on defect type, 1×M sidebands may also be present. Severe wear elevates the high‑frequency noise floor between 70×M and 100×M.
Common Diagnostic Strategies
Accurate bearing wear detection requires a consistent data‑collection and analysis methodology. Broadband meters often miss early wear, offering limited warning before catastrophic failure. High‑frequency shock or ultrasonic methods can detect early wear but miss lower‑frequency faults such as imbalance or misalignment.
Triaxial narrow‑band spectral analysis with relative acceptance criteria provides reliable early detection and can diagnose a wide range of faults—imbalance, misalignment, impeller clearance, looseness, resonance. This study employs that approach.
The narrow‑band data set includes two high‑resolution (800 lines) triaxial spectra from a single point on a rigid bearing housing. The low‑range spectrum covers 0–10 orders of shaft speed, capturing fundamental bearing tones. The high‑range spectrum spans 0–100 orders, revealing bearing tone harmonics and the high‑frequency noise floor. While extensive, the barcode‑based setup enables rapid, repeatable data acquisition, and PC processing is quick and automated.
The fault model for bearing defects includes four key indicators:
- Harmonic series of peaks at a non‑synchronous fundamental frequency.
- 1×M and/or FTF sidebands around those peaks.
- Elevated high‑frequency noise floor.
- Harmonic series at shaft‑rotation rate due to bearing looseness.
Vibration Analysis: Human vs. Computer
The volume of narrow‑band data required for accurate diagnosis necessitates computer‑based processing. A personal computer, equipped with an expert system, can perform the following steps in seconds:
- Normalize spectra relative to shaft speed.
- Extract amplitudes of key forcing frequencies and ancillary peaks.
- Apply the fault model to identify defect patterns.
- Quantify severity based on the pattern’s prominence.
These logic rules were calibrated by comparing automated diagnoses against expert analyses of a large machine population, ensuring that the computer’s conclusions mirror a seasoned vibration analyst’s judgments.
Figure 5 shows the text‑based diagnostic report generated by the expert system for Chiller 4.
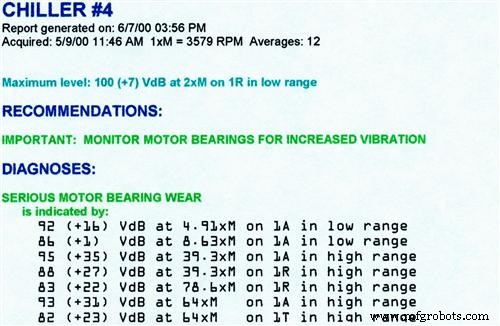
Figure 5. Computer‑generated diagnostic results for Chiller 4.
Manual Review of Spectral Data
Figure 6 presents the motor‑free‑end data collected on March 25 for Chiller 4. The average + σ mask (red) is overlaid for comparison. The horizontal axis is scaled in “orders,” where 1 order equals one shaft rotation.
Prominent non‑synchronous peaks appear at 4.9×M and 7.1×M in the axial low‑range data—exactly the BPFO and BPFI for the motor bearing. In the high‑range spectra, harmonics spaced at 4.9×M confirm the BPFO harmonic series. The high‑frequency noise floor matches the σ mask, indicating that wear is present but not yet critical.
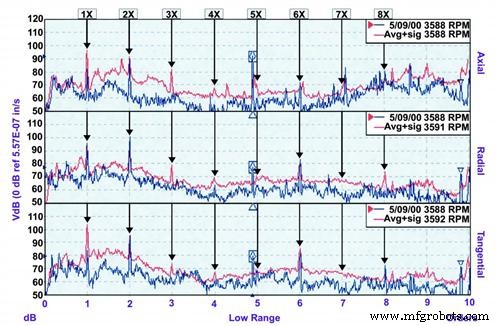
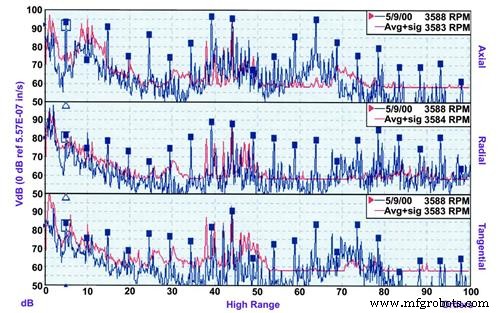
Figure 6. Triaxial vibration spectra for the motor free‑end bearing on Chiller 4. Left: low‑range data; right: high‑range data. Marked peaks show a 4.9×M BPFO harmonic series.
Prognostics
Once a bearing fault is confirmed, the next question is remaining life. A skilled analyst defers judgment until multiple data sets reveal a trend. The expert system calculates a severity score based on three factors:
- The number of supporting peaks.
- The extent to which each peak exceeds the criterion.
- The absolute amplitude of each peak.
Severity scores are mapped onto a scale of slight, moderate, serious, and extreme. In the trend plot (Figure 7), the bearing‑wear severity has stabilized at a low‑serious level.
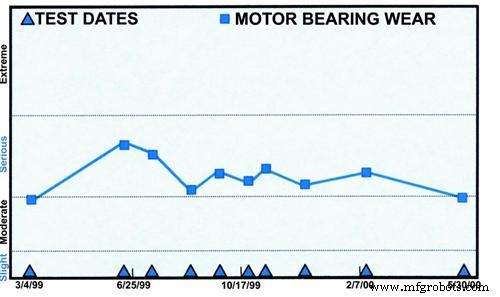
Figure 7. Expert system trend plot for Chiller 4.
The bearing’s lifespan is largely dictated by load; current data show no worsening over the past year. Vibration analysis delivers quantifiable evidence of bearing health, enabling proactive decisions. As wear escalates, the system will elevate the severity score accordingly.
During an earlier service visit, a manufacturer engineer used an overall vibration meter and concluded that the bearing was fine. The manufacturer’s 0.25 in/s peak limit was likely satisfied, illustrating a key limitation of broadband measurements for predictive maintenance—they miss subtle, non‑synchronous signatures such as BPFO harmonics.
Conclusion
To maximize bearing life, facility engineers should continuously monitor each machine against its model‑specific average + 1 σ baseline. The expert system’s severity score offers a consistent, objective trend that informs timely maintenance decisions. When severity approaches the extreme level, a bearing replacement should be scheduled, and the removed bearing inspected to close the diagnostic loop.
About Azima DLI
Azima DLI is a leading provider of predictive machine‑condition monitoring and analysis, delivering reliable, scalable solutions that align with customers’ high standards for uptime. Their WATCHMAN Reliability Services combine flexible deployment, proven diagnostic software, and deep analytical expertise to deliver sustainable, cost‑effective condition‑based maintenance programs. With headquarters in Woburn, Massachusetts, and a global presence across the U.S., Asia‑Pacific, Central America, Europe, and South America, Azima DLI helps customers maximize asset availability and productivity. For more information, visit www.azimadli.com.
Equipment Maintenance and Repair
- High Vibration in New Centrifugal Pump Traced to Faulty Motor Mounts
- Root Cause Analysis: Strengthening Plant Reliability
- Bearing Analysis: Diagnose Issues Early, Prevent Failures
- Step-by-Step Guide to Safely Removing a Bearing for Repair
- Eliminating Bearing Failures: How Strategic Partnerships Boosted Reliability and Saved $230K
- Vibration Analysis Fundamentals: A Practical Guide for Predictive Maintenance
- Combatting Corrosion in Mounted Bearings: Innovations & Best Practices
- How Vibration Analysis Drives Predictive Maintenance Success
- Maximizing Efficiency: How Preventive Maintenance Software Drives Success in Manufacturing
- Leveraging RPA for Software Testing: A Strategic Approach