


P‑F Curve Explained: Mastering Reliability‑Centred Maintenance
Ever scheduled a maintenance visit only to have your vehicle break down a week later? It’s often a sign of unpredictable machine failure, not a faulty mechanic. Understanding and applying the P‑F curve—the cornerstone of reliability‑centred maintenance (RCM)—can help you anticipate and prevent such surprises.
The P‑F Curve: The Core of RCM
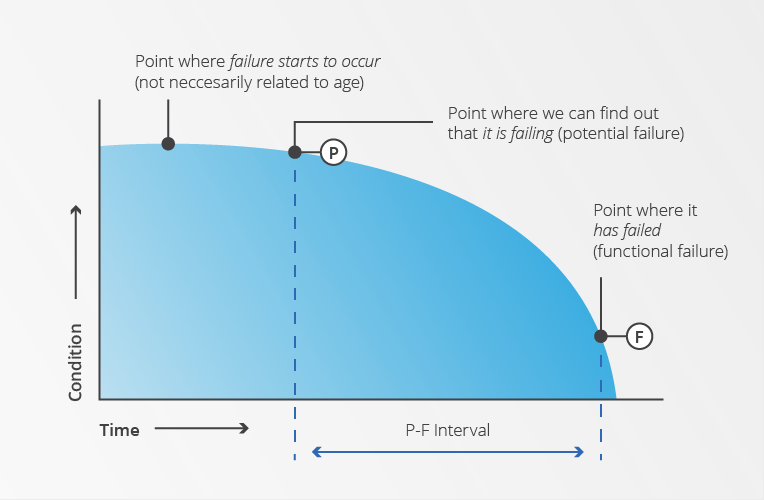
The P‑F curve plots time on the X‑axis against asset condition on the Y‑axis, illustrating how equipment degrades before it actually fails. By mapping historical data, the curve predicts when a piece of equipment is likely to reach a failure threshold.
Source: www.maintworld.com
The Meaning Behind the P‑F Curve
In a P‑F curve, P stands for potential failure—the earliest point where data suggests a failure could occur. For example, a bearing might show a temperature rise above 60 °C, indicating a potential failure condition.
F represents the functional failure, the actual breakdown. If historical analysis shows a four‑day window between the temperature spike (P) and the bearing’s failure (F), inspections should be scheduled within that interval—perhaps every two days—to catch the issue before it escalates.
RCM’s strength lies in this nuanced approach. Rather than rigid, fixed‑interval checks, the P‑F curve tailors inspection timing to each asset’s unique failure profile, allowing fewer but more targeted maintenance actions.
The P‑F Interval: Timing Is Everything
The P‑F interval is the period between potential and functional failure. Inspections must occur at a cadence that’s shorter than this interval to intercept a fault after detection but before it becomes critical.
Track all major failure modes with this free FMEA template
Inspection Techniques for the P‑F Interval
Effective RCM relies on a toolbox of condition‑based diagnostics. MaintWorld outlines these in their guide, “Maximizing the P‑F Interval Through Condition‑Based Maintenance”:
- Lubricant Sampling and Analysis
- Corrosion Monitoring
- Motor Current Analysis
- Acoustic Emission Detection (e.g., ultrasound)
- Vibration Measurement and Analysis
- IR Thermography
- Process Parameter Trending (flows, rates, pressures, temperatures, etc.)
- Process Control Instrumentation (measurement and trending)
- Visual Inspection (look, listen, feel)
These tasks demand specialized training and expertise, which explains why RCM is often regarded as the most sophisticated maintenance strategy.
Why Reliability‑Centred Maintenance Matters
Although RCM can be complex, the payoff is substantial: a systematic framework that aligns inspections with each asset’s specific failure modes dramatically boosts reliability and reduces downtime. By correctly applying the P‑F curve, you bring RCM within practical reach and unlock its full benefits for your operations.
Equipment Maintenance and Repair
- Preventive Maintenance Software Explained: Features, Benefits, and Implementation Guide
- 12 Essential Maintenance Templates to Streamline Operations and Reduce Admin Burden
- Simplify Maintenance: Leverage Basic Senses and Practical Insight
- 5 Key Drivers of Equipment Failure and Proven Prevention Strategies
- Breakdown Maintenance Explained: Rapid Response & Cost Control
- Mastering C# Queues: Enqueue, Dequeue, and First‑In‑First‑Out Operations Explained
- Mastering the Raspberry Pi Camera Pinout: A Complete Guide to Setup and Usage
- PIC18 Microcontrollers: Features, Performance, and How to Use Them
- Arduino SD Card 101: Setup, Connection, and Usage Guide
- Understanding Reference Designators: How to Label PCB Assembly Connections