Industrial manufacturing

Eigenvalues and eigenvectors are fundamental concepts in linear algebra, widely used in various fields, including physics, engineering, and data analysis. In MATLAB, these concepts can be explored and computed easily. What is EigenValues? An eigenvalue is a scalar, denoted as (lambda), associat
MATLAB, a powerful numerical computing environment, supports Object-Oriented Programming (OOP) to facilitate the creation of complex, reusable code. OOP in MATLAB revolves around the concept of classes and objects. Following are the Object Oriented features supported in Matlab. Object Class En
The Inverse Cosine Transform, often denoted as ICT or IDCT, is a mathematical operation that reverses the process of the Cosine Transform. It is particularly useful in signal and image processing for reconstructing signals or images from their frequency domain representations. In the context of
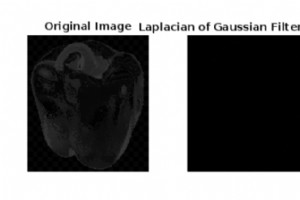
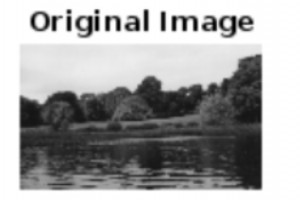
A Gaussian filter is a linear filter used in image processing to blur or smooth images. It is named after the Gaussian function, which is used to define the filters shape. The Gaussian filter is commonly used to reduce noise and detail in an image, making it more suitable for further processing
In mathematics, a derivative represents the rate of change of a function with respect to a variable. In simple terms, it tells us how a function is changing at any given point. Derivatives are fundamental in calculus and are widely used in fields like physics, engineering, and economics to mo
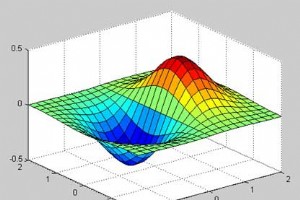
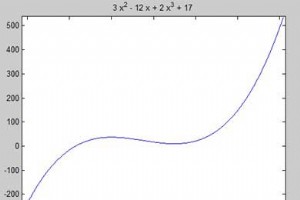
MATLAB provides powerful tools for visualizing mathematical expressions or functions. You can plot a wide range of functions, from simple linear equations to complex mathematical expressions, and visualize them in 2D or 3D space. This capability is particularly useful for engineers, scientists,
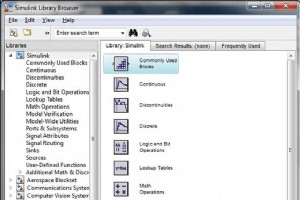
Simulink is a simulation and model-based design environment for dynamic and embedded systems, integrated with MATLAB. Simulink, also developed by MathWorks, is a data flow graphical programming language tool for modelling, simulating and analyzing multi-domain dynamic systems. It is basically a
GNU Octave is a high-level programming language like MATLAB and it is mostly compatible with MATLAB. It is also used for numerical computations. Octave has the following common features with MATLAB − matrices are fundamental data type it has built-in support for complex numbers it has bu
MATLAB provides command for working with transforms, such as the Laplace and Fourier transforms. Transforms are used in science and engineering as a tool for simplifying analysis and look at data from another angle. For example, the Fourier transform allows us to convert a signal represented as
MATLAB represents polynomials as row vectors containing coefficients ordered by descending powers. For example, the equation P(x) = x4 + 7x3 - 5x + 9 could be represented as − p = [1 7 0 -5 9]; Evaluating Polynomials The polyval function is used for evaluating a polynomial at a specified
Integration deals with two essentially different types of problems. In the first type, derivative of a function is given and we want to find the function. Therefore, we basically reverse the process of differentiation. This reverse process is known as anti-differentiation, or finding the primi
MATLAB provides the diff command for computing symbolic derivatives. In its simplest form, you pass the function you want to differentiate to diff command as an argument. For example, let us compute the derivative of the function f(t) = 3t2 + 2t-2 Example Create a script file and type the follo
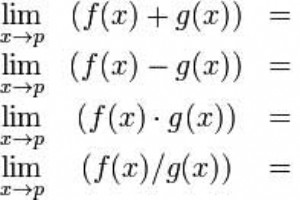
MATLAB provides various ways for solving problems of differential and integral calculus, solving differential equations of any degree and calculation of limits. Best of all, you can easily plot the graphs of complex functions and check maxima, minima and other stationery points on a graph by so
So far, we have seen that all the examples work in MATLAB as well as its GNU, alternatively called Octave. But for solving basic algebraic equations, both MATLAB and Octave are little different, so we will try to cover MATLAB and Octave in separate sections. We will also discuss factorizing a
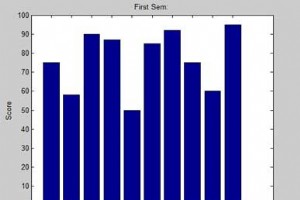
This chapter will continue exploring the plotting and graphics capabilities of MATLAB. We will discuss − Drawing bar charts Drawing contours Three dimensional plots Drawing Bar Charts The bar command draws a two dimensional bar chart. Let us take up an example to demonstrate the idea. E
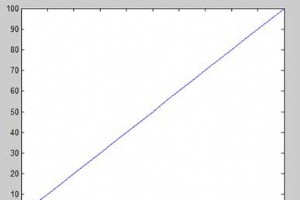
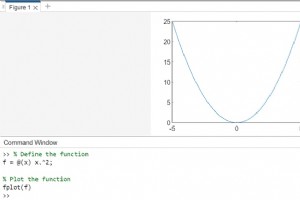
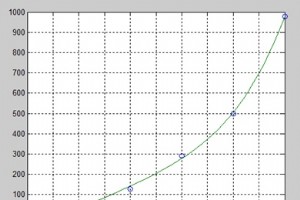
To plot the graph of a function, you need to take the following steps − Define x, by specifying the range of values for the variable x, for which the function is to be plotted Define the function, y = f(x) Call the plot command, as plot(x, y) Following example would demonstrate the conc
Data export (or output) in MATLAB means to write into files. MATLAB allows you to use your data in another application that reads ASCII files. For this, MATLAB provides several data export options. You can create the following type of files − Rectangular, delimited ASCII data file from a

Importing data in MATLAB means loading data from an external file. The importdata function allows loading various data files of different formats. It has the following five forms − Sr.No. Function & Description 1 A = importdata(filename) Loads data into array A from the file deno
A function is a group of statements that together perform a task. In MATLAB, functions are defined in separate files. The name of the file and of the function should be the same. Functions operate on variables within their own workspace, which is also called the local workspace, separate from t
Creating a character string is quite simple in MATLAB. In fact, we have used it many times. For example, you type the following in the command prompt − Live Demo my_string = Tutorials Point MATLAB will execute the above statement and return the following result − my_string = T
MATLAB