


Understanding Boolean Relationships Using Venn Diagrams
The fourth illustration shows set A partially overlapping set B. We first consider the full hatched area that represents the union of both sets, and later isolate the intersection.
Below left, a red horizontal hatched region denotes A; a blue vertical hatched region denotes B.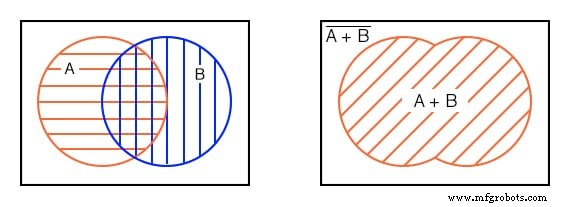
When we aggregate all hatched regions—regardless of hatch style—the resulting area corresponds to the inclusive OR function of A and B. The Boolean expression is A + B.
In the diagram, the 45° hatched band represents the union. Anything outside this hatched area is the complement, (A + B)'.
Next, we examine the intersection of A and B. The double‑hatched zone on the left represents the exclusive AND function, expressed as AB. The region outside the double‑hatched area is (AB)'.
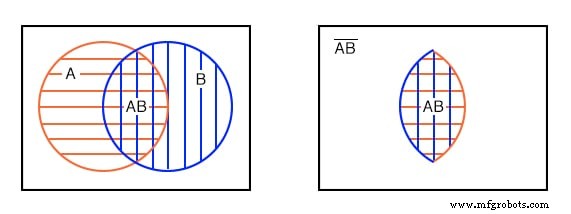
Observe that some elements of A belong to (AB)', and likewise for B. However, no element of (AB)' lies within the double‑hatched AB region.
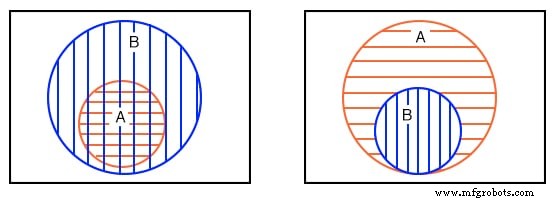
The second example is repeated on the left. The fifth example, sketched earlier, appears on the right for comparison. In subsequent sections we will identify elements that are entirely contained within another set using Karnaugh maps.
We now introduce a Boolean expression that includes a complemented variable.
Example: Visualize the expression A'B (A NOT AND B) with a Venn diagram.
Solution: Beginning at the top left, shade A' with a red horizontal hatch. At the top right, shade B with a blue vertical hatch. The overlapping region at the bottom left represents A'B. Most students illustrate the entire double‑hatched area on the right for clarity. The complement (A'B)' is the unshaded area outside this region.
We next tackle the OR operation with a complemented variable.
Example: Determine the region for B' + A.
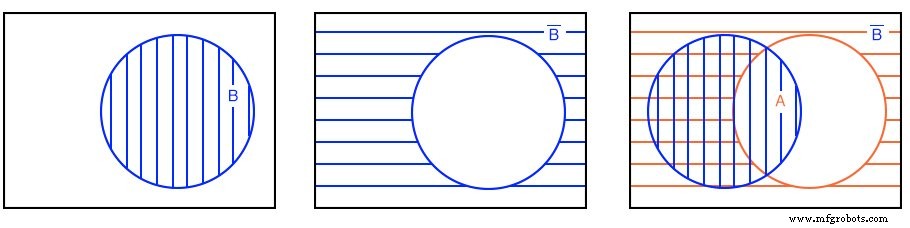
Solution: On the right, begin with B, shade it, then complement to B'. Overlay A on top. The union of all hatched areas, regardless of style, gives A + B'. This is shown as a single hatched region on the left for clarity.
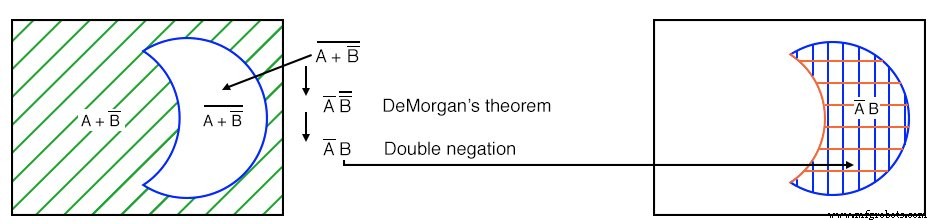
Example: Find the complement (A + B')’.
Solution: The white clear area in the left diagram corresponds to (A + B')’. The green 45° hatched band previously illustrated the union A + B'. Comparing the complement to the double‑hatched region AB' on the right shows that the two shapes are identical, confirming De Morgan’s theorem and double negation.
Venn diagrams provide intuitive visual checks but do not constitute formal proofs; Boolean algebra is required for rigorous verification. Nonetheless, they are invaluable for illustrating concepts like De Morgan’s theorem.
Example: Depict the expression A' + B' on a Venn diagram.
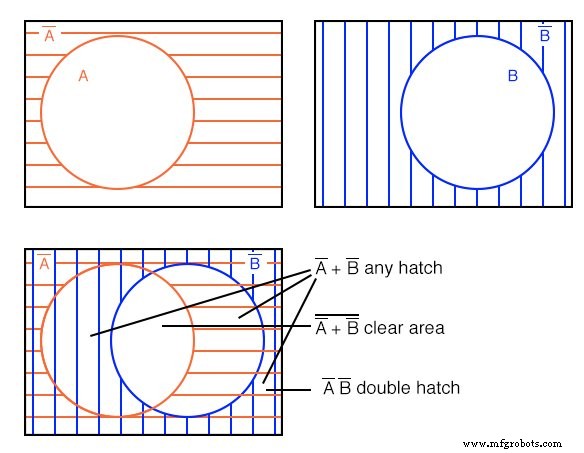
Solution: Shade A' with a red horizontal hatch and B' with a blue vertical hatch. The resulting figure shows all regions that contain at least one hatch, corresponding to A' + B'. The only unshaded area is the central overlap of the original circles.
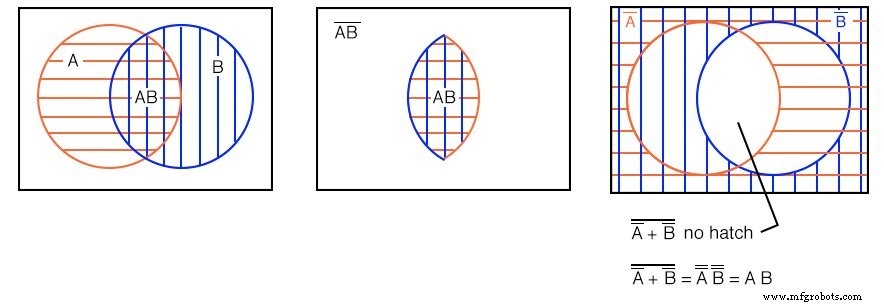
Example: Visualize (A' + B')’.
Solution: The central white space represents the complement of the previous diagram. This is exactly the region (A' + B')’.
Example: Verify that (A' + B')’ = AB.
Solution: The lower‑left diagram shows the open region for (A' + B')’. The left and middle diagrams depict the double‑hatched intersection AB. They match perfectly, confirming the identity via De Morgan’s theorem and double negation.
Finally, we present a three‑variable Venn diagram with A (red), B (blue), and C (green 45°). The central region where all three overlap represents ABC. Larger petal‑shaped zones illustrate pairwise intersections: AB, AC, and BC. As the number of variables in an AND term increases, the corresponding region shrinks: A alone is a large circle; AB is a smaller petal; ABC is the smallest.
- A (1‑variable): large circular region.
- AB (2‑variables): smaller petal‑shaped region.
- ABC (3‑variables): smallest region.
- More variables → smaller AND region.
Industrial Technology
- Switches, Electrically Actuated (Relays): The Ladder Logic Legacy
- Understanding Ladder Diagrams: Design, Wiring, and Safety in Industrial Control Systems
- Understanding Boolean Algebra: From Logic Foundations to Digital Circuits
- Boolean Arithmetic: Adding, Multiplying, and Complementing in Digital Logic
- Key Boolean Algebraic Identities: A Comprehensive Overview
- Core Boolean Algebra Laws: Commutative, Associative, and Distributive Properties
- Essential Boolean Simplification Rules for Logic Circuit Design
- Simplifying Gate Circuits: Step‑by‑Step Boolean Algebra Techniques
- Choosing the Right Tool for Logic Simplification: Karnaugh Maps, Boolean Algebra, and CAD
- Understanding Venn Diagrams: Visualizing Set Relationships