


Temperature Coefficient of Resistance: How Temperature Alters Conductivity
When you look at a standard resistance table, you’ll notice every value is quoted at 20 °C. That’s because a material’s specific resistance changes with temperature. If you need the resistance of a conductor at a different temperature, you must apply the temperature‑coefficient formula.
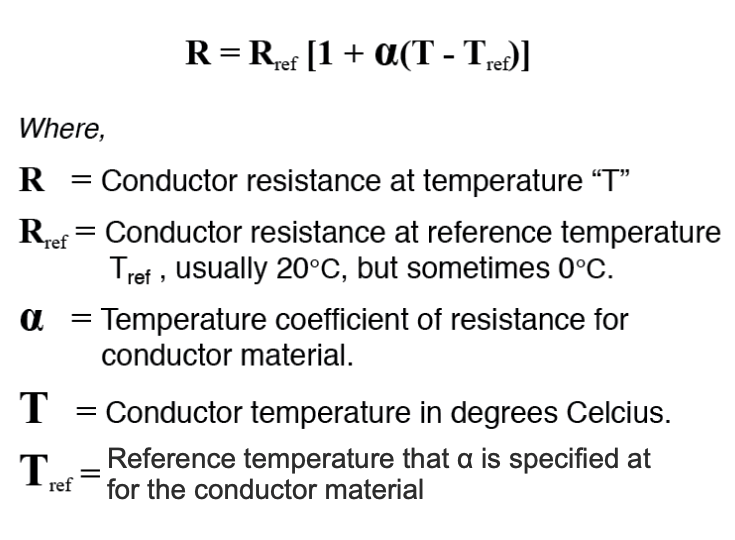
The Greek symbol α (alpha) represents the temperature coefficient of resistance—the percentage change in resistance per degree Celsius. Pure metals have positive α values, meaning their resistance rises as temperature climbs. In contrast, semiconductors like carbon, silicon, and germanium have negative α values, so their resistance falls with heat. Some alloys, such as nichrome, are engineered to have α values close to zero, making them ideal for precision resistors.
Temperature Coefficients of Resistance at 20 °C
| Material | Element / Alloy | α (per °C) |
|---|---|---|
| Nickel | Element | 0.005866 |
| Iron | Element | 0.005671 |
| Molybdenum | Element | 0.004579 |
| Tungsten | Element | 0.004403 |
| Aluminum | Element | 0.004308 |
| Copper | Element | 0.004041 |
| Silver | Element | 0.003819 |
| Platinum | Element | 0.003729 |
| Gold | Element | 0.003715 |
| Zinc | Element | 0.003847 |
| Steel* | Alloy | 0.003 |
| Nichrome | Alloy | 0.00017 |
| Nichrome V | Alloy | 0.00013 |
| Manganin | Alloy | ±0.000015 |
| Constantan | Alloy | -0.000074 |
* Steel alloy (99.5 % Fe, 0.5 % C)
Let’s explore how temperature influences wire resistance in a simple circuit.
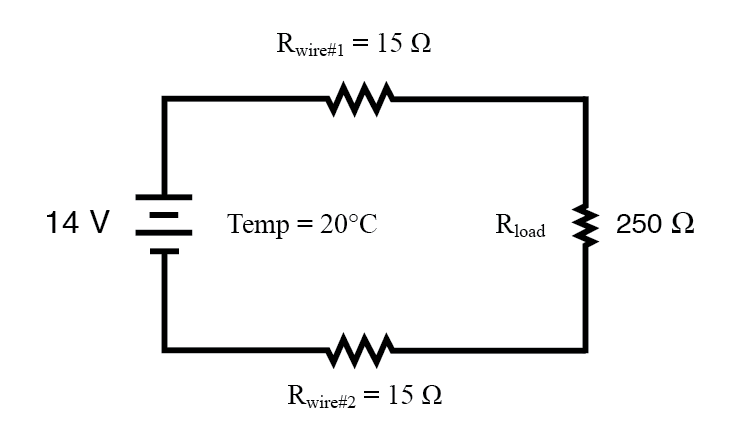
The total resistance of the two wires is 30 Ω at 20 °C. The table below lists voltage, current, and resistance values at that temperature.
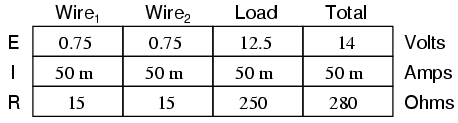
At 20 °C we observe 12.5 V across the load and a 0.75 V drop across the wires (0.75 Ω each). If the temperature rises to 35 °C, the copper wires’ resistance increases because α = 0.004041. The new resistance for each wire is:
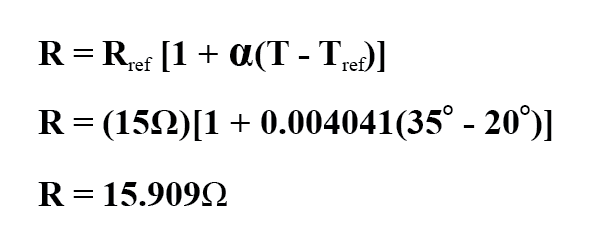
Re‑calculating the circuit gives the following results:
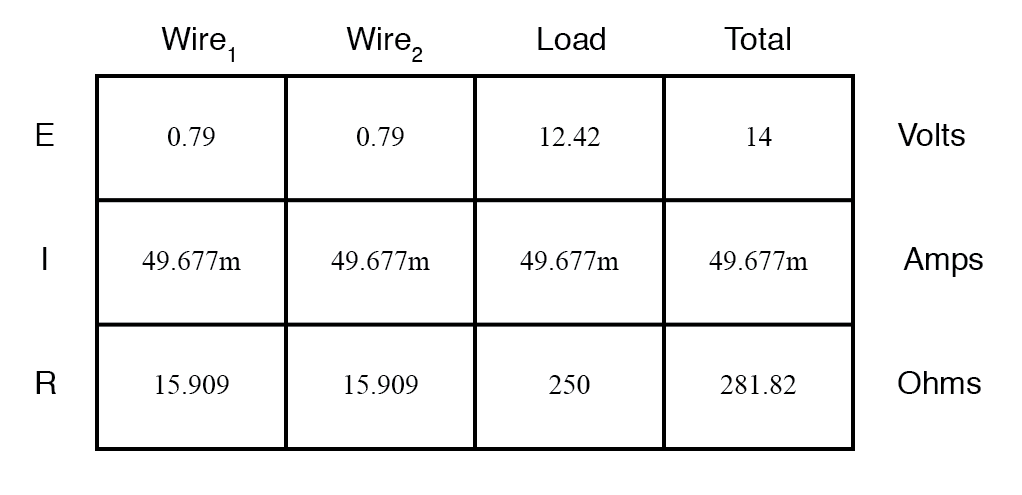
We see the load voltage drops from 12.5 V to 12.42 V, while the voltage drop across the wires increases from 0.75 V to 0.79 V. These changes may seem minor, but over long power lines the cumulative effect is substantial. Utility companies routinely factor temperature‑induced resistance variations into their load‑capacity calculations.
Key Takeaways
- Conductive materials exhibit temperature‑dependent resistance; tables always reference a standard temperature (usually 20 °C or 25 °C).
- The temperature‑coefficient of resistance (α) quantifies how much resistance changes per degree Celsius.
- Positive α values (typical for pure metals) mean resistance rises with temperature; near‑zero α values (achieved by alloying) provide temperature‑stable resistors.
- Negative α values (found in semiconductors) mean resistance falls as temperature climbs.
- Use the formula shown above to calculate resistance at any temperature outside the standard reference.
For further practice, try the Temperature Coefficient of Resistance Worksheet.
Industrial Technology
- Exploring Nonlinear Resistance in Incandescent Lamps: A Practical Lab Guide
- Thermoelectricity: Understanding Thermocouples and the Seebeck Effect
- Comprehensive Table of Temperature Coefficients of Resistance for Metals and Alloys
- Resistors: Fundamentals, Types, and Practical Applications
- Understanding Conductance: The Inverse of Resistance
- Calculating Wire Resistance for Voltage‑Drop‑Critical Circuits
- The Thermometer: From Galileo’s Thermoscope to Modern Digital Sensors
- Fiberglass Adhesive Tape – Unmatched –40°C to 260°C Heat Resistance for Industrial Applications
- AuGe12: Premium Gold-Based Soft Solder Alloy
- Rhenium: The Ultra‑High‑Density Metal for Filaments and Refractory Applications